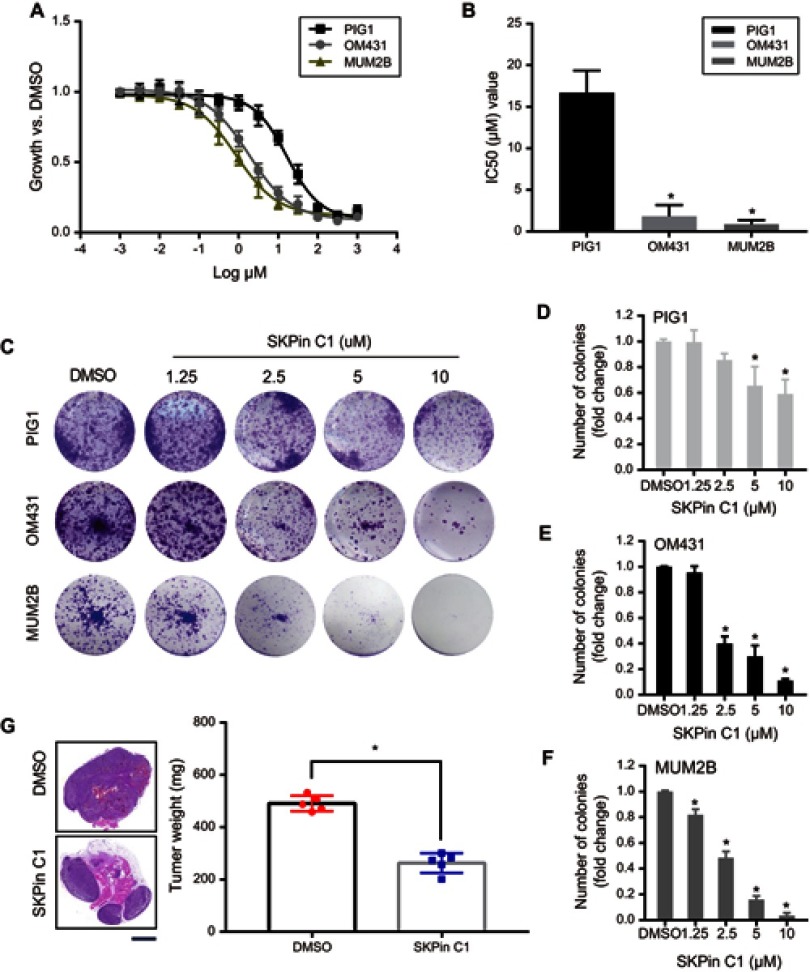
Figure 3.
SKPin C1 inhibits UM growth in vitro and in vivo. (A) Survival curves of PIG1, OM431 and MUM2B cells according to the sensitivity to SKPin C1. Data are represented as mean ± SD, n =3. (B) IC50 value of SKPin C1 in PIG1, OM431 and MUM2B cells. Data are represented as mean ± SD, n =3. *P<0.05. (C) Colony formation assays were performed to determine the colony formation ability of UM cells treated with different concentration SKPin C1. (D–F) Quantification of visible colonies. The colony number in the DMSO group was set as 100%. All the experiments were performed in triplicate, and the relative colony formation rates are shown as the mean ± SD. *P<0.05. (G) Tumorigenesis ability in a xenograft in vivo assay model. UM cells were injected to the left flank of five-week-old male nude mice in this assay (n=5 per group). Mice were killed at four weeks after injection of cells and SKPin C1. Tumor weight was measured and was presented as the mean ± SD. *P<0.05. The tumors were prepared for HE staining and histological analysis. Representative images were shown. scale bar: 2 mm.
Abbreviations: SKPin C1, SKP2 inhibitor C1; DMSO, Dimethyl Sulfoxide; HE, hematoxylin-eosin.

