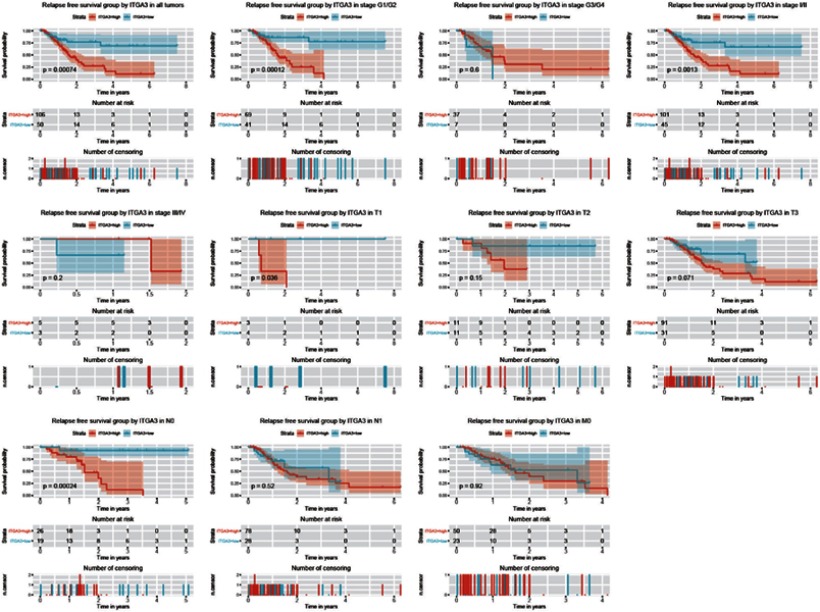
Figure 4.
Relationship of pancreatic ITGA3 expression with relapse-free survival. Kaplan– Meier curves show relapse-free survival following subgrouping for clinical stage (I/II and III/IV), histological grade (G1/G2 and G3/G4), T classification (T1, T2, and T3), N classification (N0 and N1), and M classification (M0).

