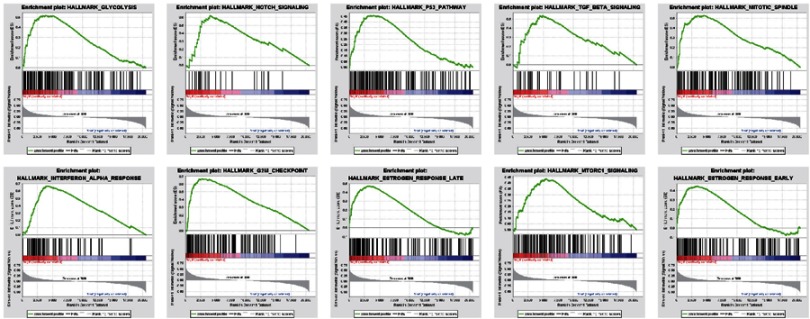
Figure 5.
Gene set enrichment analysis (GSEA) of signaling pathways activated during pancreatic cancer. Comparison of data sets with low and high expression of ITGA3 indicated the high expression phenotype had enrichment of glycolysis, notch signaling, P53 signaling, TGF-β signaling, the mitotic spindle, interferon alpha response, G2M checkpoint, estrogen response, and mTOR signaling.

