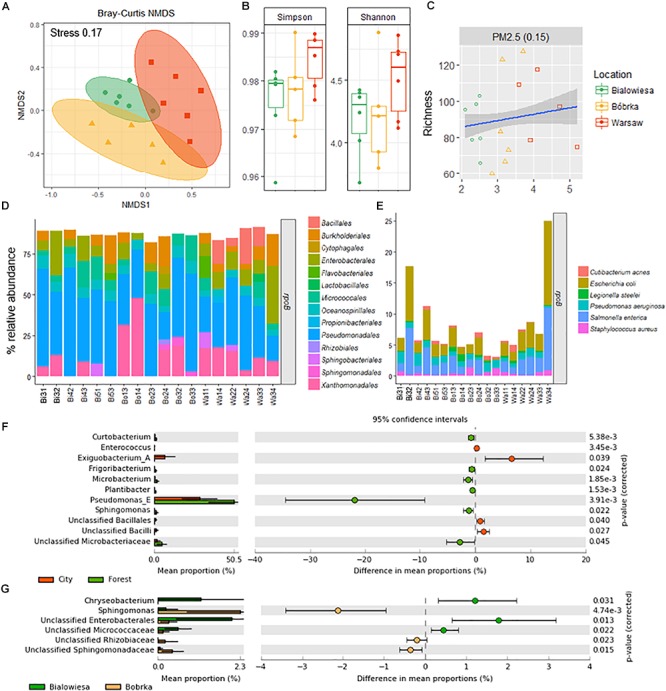
Figure 3.

Diversity analyses and relative abundance bar charts of shotgun-derived operational taxonomic unit data. (A) NMDS plot based on the Bray–Curtis dissimilatory matrix, (B) alpha-diversity box plots, (C) correlation plot showing PM2.5 concentrations against species richness, (D) bar charts showing the bacterial community composition in % relative abundance relative to rpoB, (E) subplot of (D) showing human- and disease-related bacterial genera, (F) differentially abundant taxa in the city (Warsaw) vs. the forest (Białowieża and Bóbrka), and (G) differentially abundant taxa in the natural forest in Białowieża compared to the oil-polluted forest in Bóbrka (p < 0.05, Welch’s t-test using STAMP).
