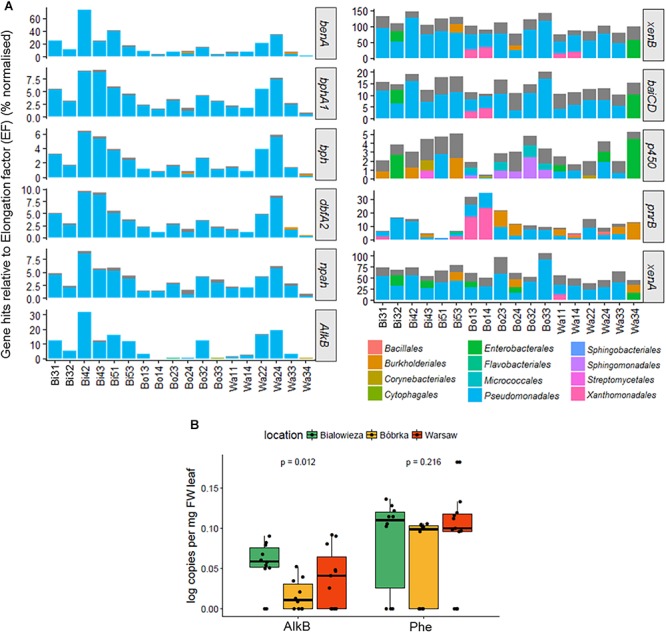
Figure 7.

(A) Bar charts showing the percentage degradation gene hits relative to the transcription elongation factor (EF) gene using MetAnnotate. (B) PCR results of alkane monooxygenase B (AlkB) and phenol monooygenase (Phe) gene copies per mg FW leaf. The plots in (A) were filtered to show only the most dominant orders with a relative abundance of 10% or higher.
