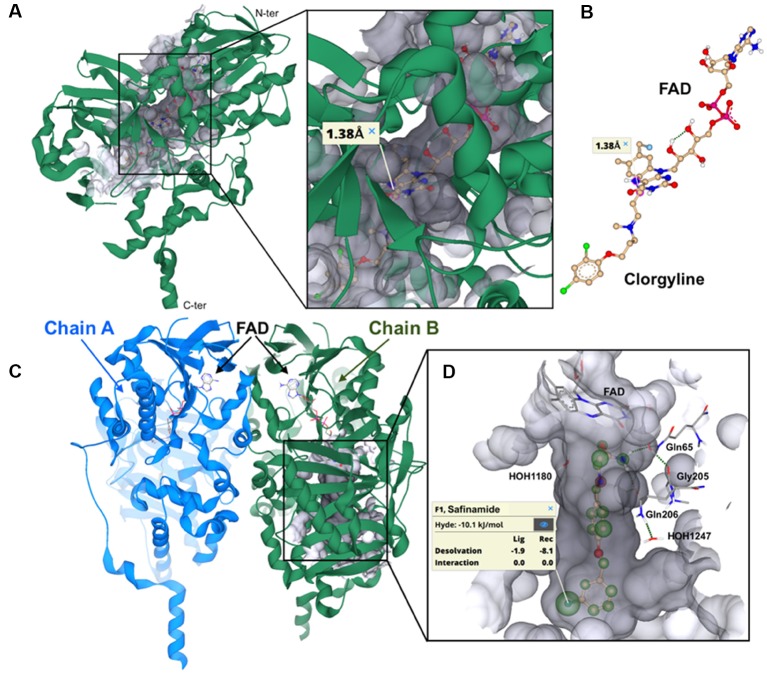
Figure 3.
Visualization of the crystal structures of hMAO-A and hMAO-B. The binding mode of irreversible and reversible MAO inhibition on the example of the most prominent MAO-A inhibitor clorgyline (irreversible) and MAO-B inhibitor safinamide (reversible) is represented. (A) Ribbon representation of the co-crystallized structure of clorgyline with the monomer hMAO-A (PDB: 2BXS, resolution: 3.15 Å). The C-terminal membrane region and the N-terminus are depicted. The surface for binding site is colored in gray transparent. (B) Representation of the covalent bonding (1.38 Å) between the irreversible MAO-A inhibitor clorgyline and the FAD co-factor. (C) Ribbon representation of the co-crystallized structure of safinamide with hMAO-B (PDB: 2V5Z, resolution: 1.6 Å). The respective chain A and B of hMAO-B dimer with FAD are depicted. (D) HYDE (HYdrogen bonding and DEsolvation) analysis of desolvation effects and interactions for safinamide (off-white). HYDE visual affinity assessment as embedded in SeeSAR: green = favorable, red = unfavorable and non-colored = no relevant for affinity. The interacting amino acid residues, important water molecules and FAD are shown. Visualization and HYDE analysis were performed using the SeeSAR tool from BioSolveIT (v.8.2, 2019).

