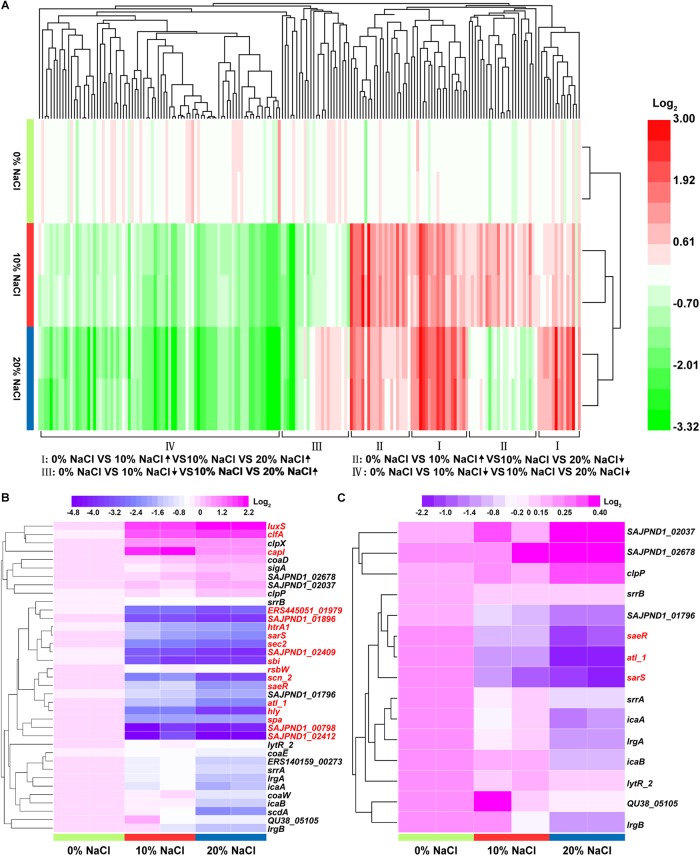
FIGURE 5.
Functional clustering analysis of the DEPs in the three comparison groups. (A) Hierarchical cluster analysis of the DEPs with increase/increase, increase/decrease, decrease/increase, and decrease/decrease regulatory patterns; (B) DEPs representing virulence factors; (C) DEPs representing biofilm formation-related enzymes. The fold-changes of the DEPs are represented by different colors. Red represents upregulated proteins and green represents downregulated proteins. The DEPs with fold changes of ≥ 1.2 or ≤0.83 and p-value ≤ 0.05 are labeled in red in Figure 5B,C.

