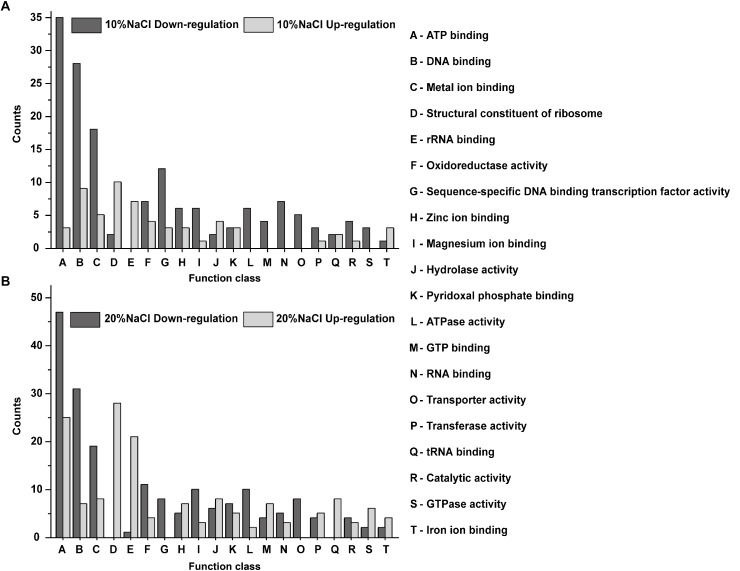
FIGURE 6.
GO functional annotations of the DEPs identified in the 10 and 20% groups compared with their levels in the control. (A) DEPs identified between 10% NaCl and control groups; (B) GO DEPs identified between 20% NaCl and control groups. The X-axis represents the GO categories, and the Y-axis represents the number of up- or downregulated DEPs in the functional classification.

