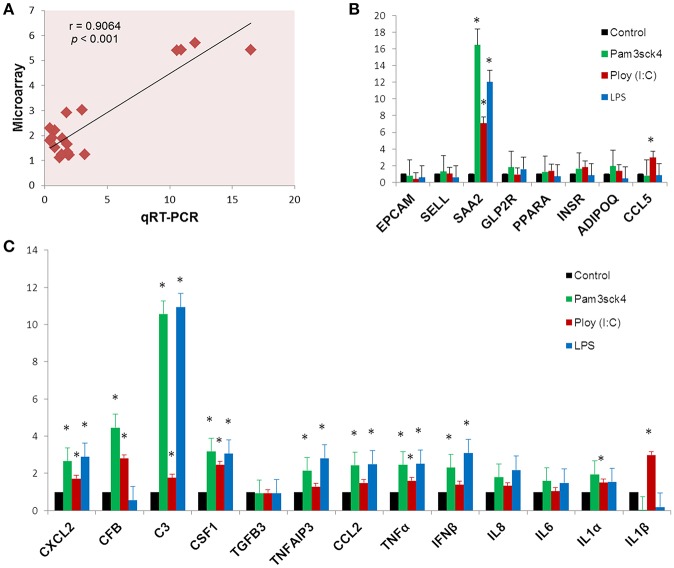
Figure 7.
Gene expression results obtained from qRT-PCR. The Pearson's correlation coefficient between expression results obtained from microarray and qRT-PCR (A). The expression profiles of metabolism (B) and immune response (C) related genes measured by qRT-PCR. Y-axis represents the fold expressions. The asterisk (*) indicates Statistical differences with significant levels of p < 0.05. Data (Mean ± SE) presented are the average of 3 independent experiments performed in triplicates.

