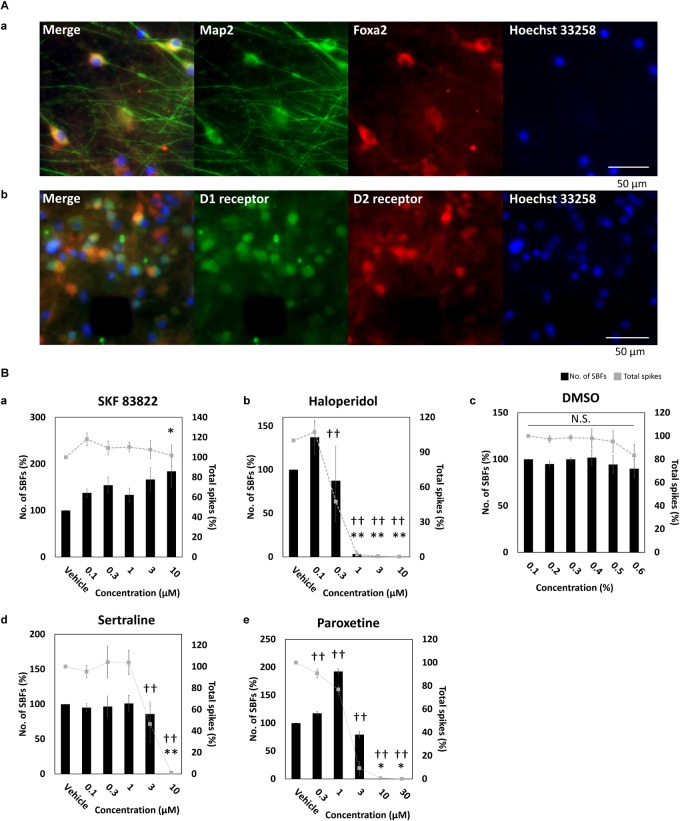
FIGURE 2.
Characterization of dopaminergic neuron. (A) Immunofluorescent image of FOXA2, and D1 and D2 receptors in cultured iCell DopaNeurons at 23 WIV. (a) FOXA2 expression. MAP2 (green), FOXA2 (red), Hoechst 33258 (blue). Scale bars = 50 μm. (b) Dopamine receptor expression. D1 receptor (green), D2 receptor (red), Hoechst 33258 (blue). Scale bars = 50 μm. (B) The change of SBFs and spikes in SKF83822, haloperidol, DMSO, sertraline, and paroxetine administration. Spontaneous activity for 10 min was measured for each concentration. Black bars indicate SBFs and gray dashed lines indicate spikes. Data were analyzed using one-way ANOVA followed by post hoc Dunnett’s test [∗p < 0.05, ∗∗p < 0.01 vs. vehicle (SBFs), †p < 0.05, ††p < 0.01 vs. vehicle (total spikes)]. (a) SKF 83822 (n = 6 wells). (b) Haloperidol (n = 5). (c) DMSO (n = 6). (d) Sertraline (n = 6). (e) Paroxetine (n = 6).

