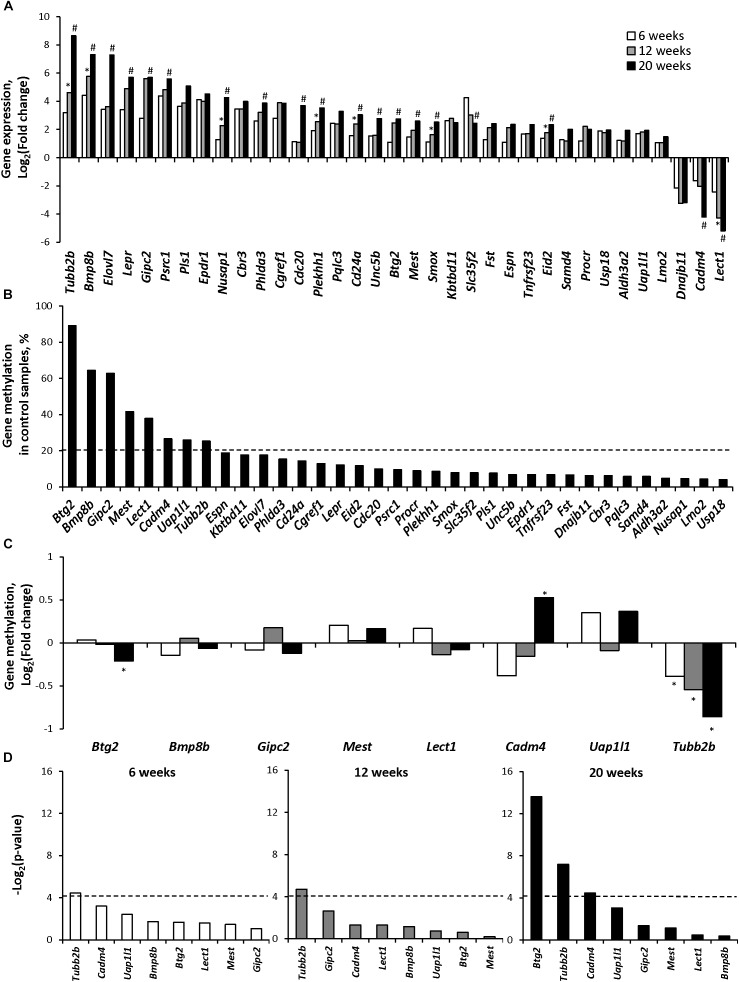
FIGURE 1.
Gene expression and gene-specific methylation of epigenetically regulated differentially expressed genes during NASH-associated liver carcinogenesis in STAM mice. (A) Expression of the selected epigenetically regulated genes at NAFL (6 weeks), NASH-fibrotic (12 weeks), and full-fledged HCC (20 weeks) stages of NASH-associated liver carcinogenesis. ∗Denotes significantly expressed genes (P < 0.05) in the livers of STAM mice at 12 weeks as compared to their expression at 6 weeks. #Denotes significantly expressed genes (P < 0.05) in the livers of STAM mice at 20 weeks as compared to their expression at 6 and 12 weeks. (B) Gene-specific methylation of selected genes in the livers of control mice. Dashed line indicates a 20% threshold methylation level. (C) Gene-specific DNA methylation changes in the promoter region of the upregulated genes that passed 20% threshold DNA methylation level in control livers or genes that were down-regulated during the development of HCC. ∗Denotes statistically a significant (P < 0.05) difference in the promoter region DNA methylation in the livers of STAM mice as compared to that in the livers of age-matched control mice. (D) Pearson correlation P-value between gene expression and promoter DNA methylation changes in the livers of mice subjected to STAM hepatocarcinogenesis at 6, 12, and 20 weeks. Dashed line indicates the threshold level, which was selected as P = 0.05 (Log2 P = −4.13).

