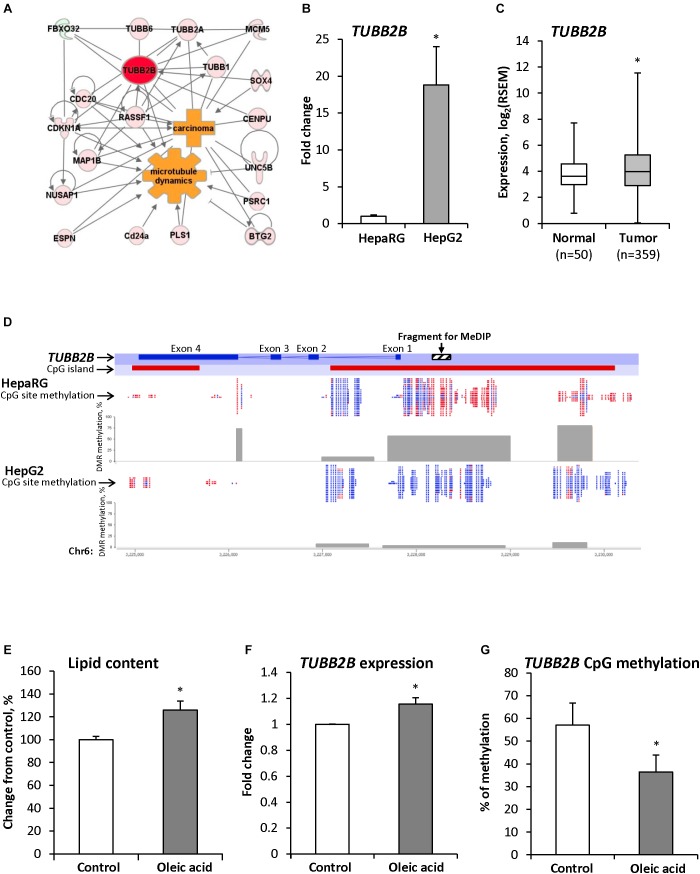
FIGURE 3.
TUBB2B gene expression and methylation aberrations during hepatocarcinogenesis. (A) Molecular network of differentially expressed genes associated with Tubb2b and microtubule dynamics in HCC of mice subjected to STAM hepatocarcinogenesis. Red color indicates up-regulated genes and green color indicates down-regulated genes. (B) Expression of the TUBB2B gene in non-tumorigenic liver HepaRG cells and human HepG2 hepatocarcinoma cells. The TUBB2B gene expression is presented as an average fold change in HepG2 cells relative to that in the fully differentiated HepaRG cells, which was assigned value 1. (C) Expression of the TUBB2B gene in human HCC samples. (D) RRBS analysis of DNA methylation in the TUBB2B gene promoter region in HepaRG and HepG2 cells. Red color indicates methylated CpG sites and blue color indicates unmethylated CpG sites. Gray boxes indicate percent of methylated CpG sites from total number of CpG sites in the differentially methylated regions (DMR). (E) The level of triglycerides in the fully differentiated human hepatic HepaRG cells after culturing cells the presence of 250 μM oleic acid for 14 days. (F,G) Expression and promoter DNA methylation of the TUBB2B gene in fully differentiated HepaRG cells after culturing cells in the presence of 250 μM oleic acid for 14 days. The TUBB2B gene expression is presented as an average fold change in the HepaRG cells treated with oleic acid relative to the gene expression in non-treated HepaRG cells, which was assigned value 1. Values are mean ± SD, n = 3. ∗Denotes statistically a significant (P < 0.05) difference of gene expression and promoter DNA methylation.

