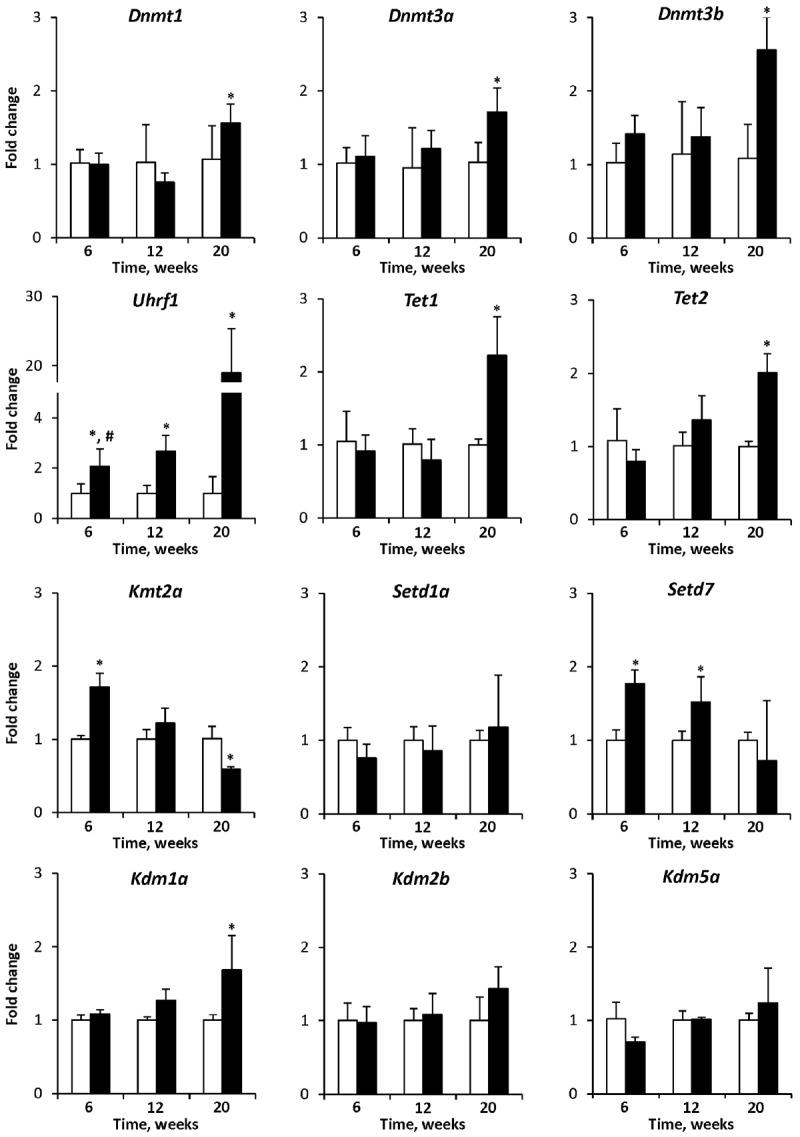
FIGURE 5.

The expression of chromatin modifying genes in the livers of control mice and STAM mice subjected to NASH-derived hepatocarcinogenesis. The results are presented as an average fold change in the expression of each gene in the livers of STAM mice at 6, 12, and 20 weeks relative to that in control age-matching mice. The data are presented as the mean ± SD; n = 4. ∗Denotes a significant (P < 0.05) difference from the control age-matching group; #denotes significant (P < 0.05) trend.
