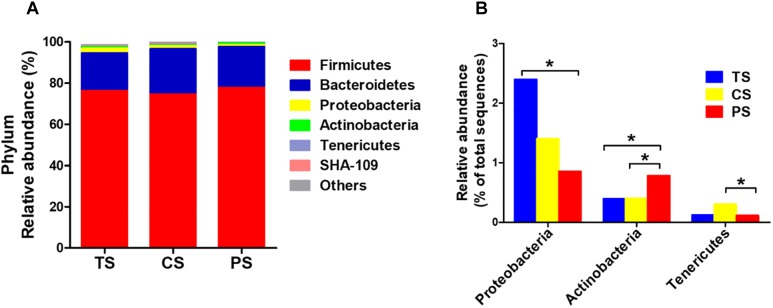
FIGURE 2.
Relative abundance of bacterial phylum in the colonic digesta of pigs (A). The significantly changed phyla in the colonic digesta (B). The values were expressed as the medians (n = 8). Statistical differences were calculated by Kruskal–Wallis H-test: ∗P < 0.05. TS, tapioca starch; CS, corn starch; PS, pea starch.

