Figure 6.

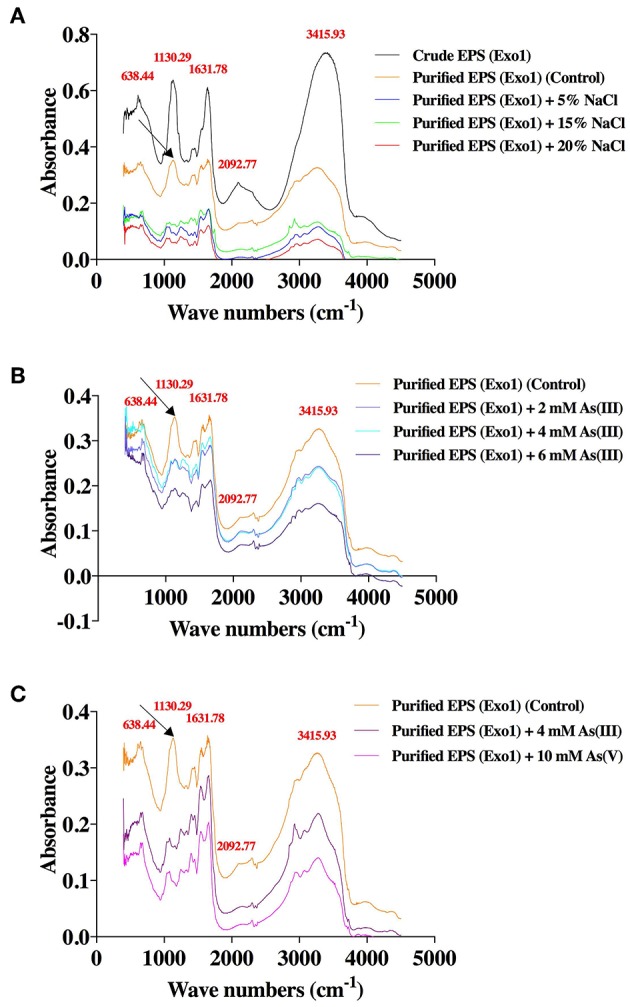
Effects of salt and arsenic stresses on the FT-IR spectra of functional groups of purified Exo1 done in solid (KBr) phase. A. In vitro assay: Exo1 extracted from cells grown in 8% TSMGM media was incubated with 5, 15, and 20% NaCl. B. In vivo assay: Purified Exo1 was extracted from bacteria grown in 8% TSMGM containing different concentrations of [As(III)]. C. In vitro assay: Purified Exo1 was extracted from bacteria grown in salt-supplemented (8% TSMGM) media without As and purified EPS was incubated in vitro with 4 mM [As(III)] and 10 mM [As(V)]. The wave numbers of distinct peaks in cm−1 are shown in red with respect to crude/purified Exo1. An arrow demarcates a peak that is absent in salt-treated purified Exo1 (A) and in As-treated purified Exo1 in case of both in vivo (B) and in vitro (C) assays.
