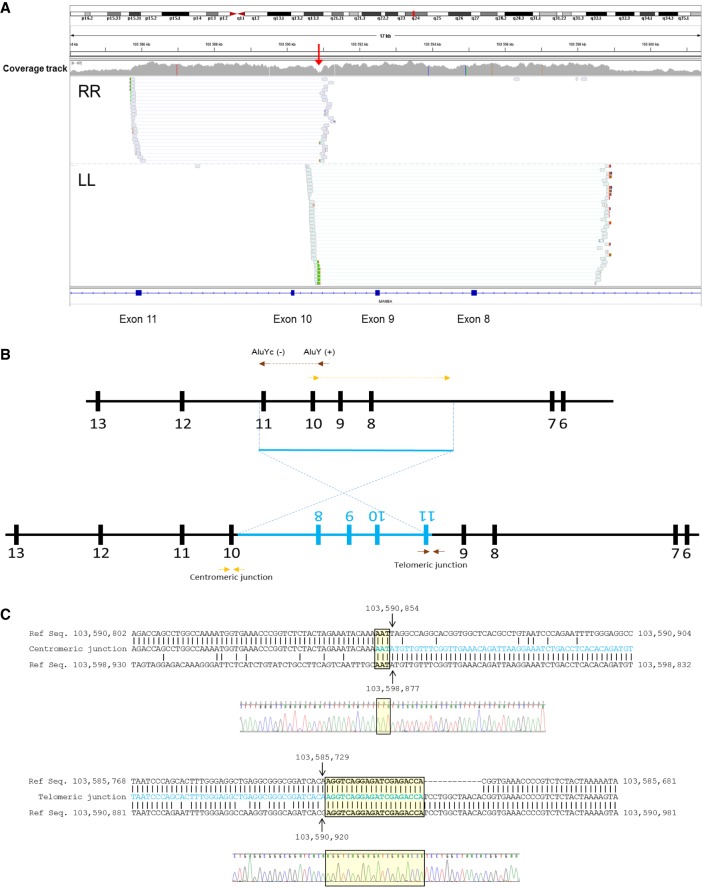
Figure 3.
WGS analysis defines both junctions at the nucleotide level. (A) Overview of WGS data encompassing the duplicated region at MANBA. The coverage track clearly defines a duplicated region from introns 7–11. The drop in coverage observed in intron 9 (red arrow) corresponds to the 67-bp nonduplicated gap observed between the insertion points. (B) Paired reads with RR (right-right) and LL (left-left) orientation suggest the existence of an inversion, diagrammed in panel. (C) Definition of both junctions at the nucleotide level obtained from WGS data and confirmed by Sanger sequencing. The inserted sequence is marked in blue. Both junctions show areas of microhomology (yellow boxes).

