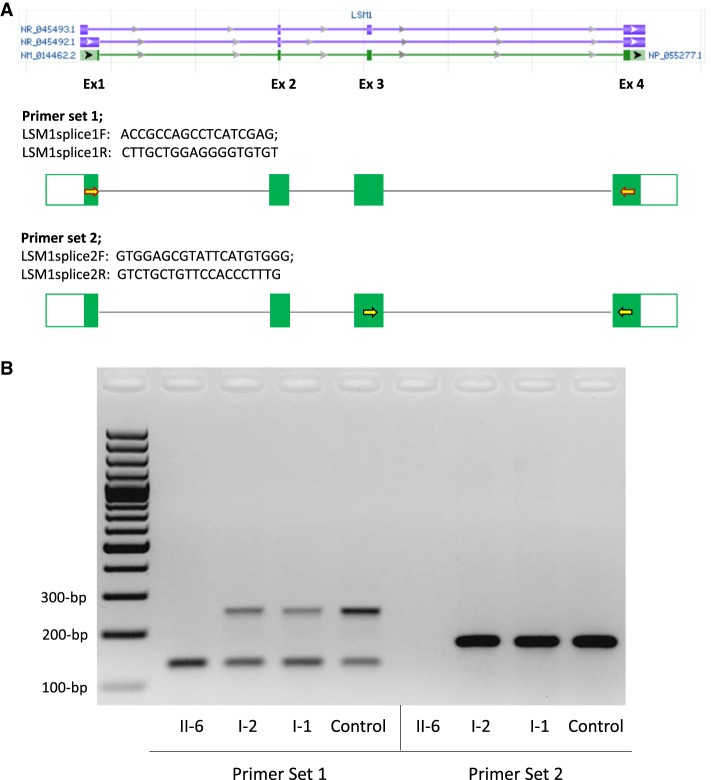
Figure 2.
Two percent agarose-gel electrophoresis image of the cDNA studies performed with two sets of primers. Peripheral blood samples were collected from one affected individual (II-6), unaffected carrier parents (I-2 and I-1), and a control. (A) Two different sets of primers were designed, given the lack of exon 3 in one noncoding isoform (NR_045492.1). Forward primer of set 1 (LSM1splice1F; yellow-filled, red outlined right arrow) maps to first exons of NM_014462.2 and NR_045492.1 only. Forward primer of set 2 (LSM1splice2F; yellow-filled, black outlined right arrow) maps to exon 3 of NM_014462.2 and NR_045493.1 only. Reverse primers of both sets (LSM1splice1R and LSM1splice2R) map to exon 4 of all isoforms. Isoform accession numbers and schematic were retrieved from NCBI Entrez Gene website (Gene ID = 27257). (B) PCRs with primer sets 1 (left) and 2 (right) revealed no band in an affected individual (II-6) corresponding to the canonical isoform. Unaffected carrier parents (I-2 and I-1) only have one band corresponding to the canonical isoform, 250-bp band on the left and 176-bp band on the right, in addition to the 134-bp noncoding RNA transcript (NR_045492.1) product (smaller band on the left) in all samples run with primer set 1.

