Figure 2.
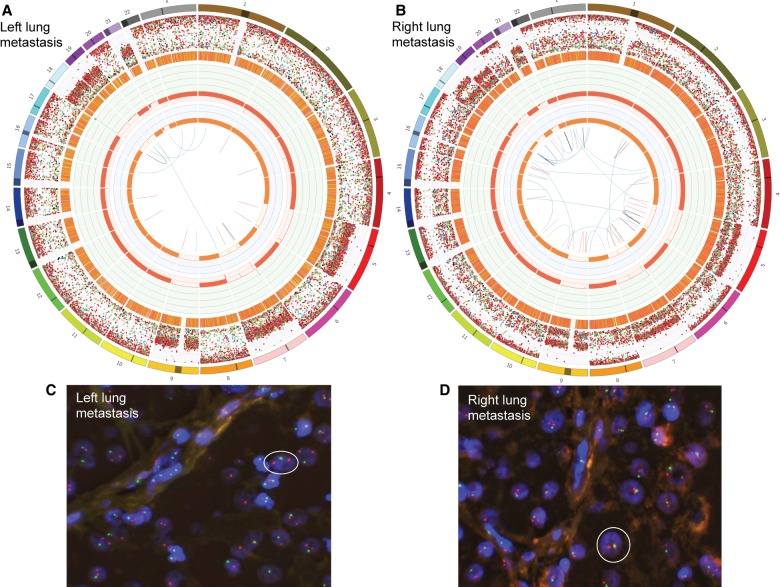
Both metastases are hyperhaploid. Circos plots generated following WGS of the patient's left lung metastasis (A) and right lung metastasis (B). From the outside of the Circos plots toward the center, chromosomes are first numbered from 1 to 22 and X. SNVs, C>A (blue), C>G (black), C>T (red), T>A (grey), T>C (green), and T>G (pink), are then represented as dots and ordered by their genomic location and variant allele frequency (VAF). The next ring shows the locations of small indels (orange). Next, purity-adjusted chromosomal copy number levels are represented in green (amplifications) and red (deletions) (scale 0–8). The innermost ring shows the copy number of the minor allele, highlighting that most chromosomes exhibit loss of heterozygosity (orange). The center of the plots represent structural variants including deletions (red), duplications (green), inversions (black), and translocations (blue). The hyperhaploid tumors were confirmed with fluorescence in situ hybridization probing Chromosomes 9 (red) and 22 (green). (C,D) White circles represent example haploid cells; cell nuclei are highlighted in blue.

