Figure 3.
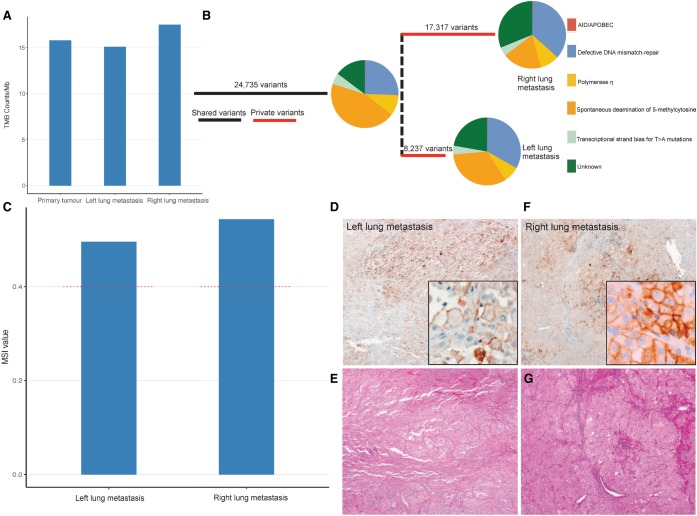
Both metastases have microsatellite instability. Plot of tumor mutation burden (TMB) mutation counts/Mb for primary tumor and each metastasis (A). Phylogenetic analysis of variants shared between, or private to either metastasis, plus somatic mutation signature analysis indicating the combined and private drivers of tumor pathology (B). Microsatellite instability (MSI) analysis was conducted using Mantis, with both metastases (blue) plotted against the recommended threshold for MSI-high tumors (red dashed line) (C). This was checked by immunohistochemistry for PD-L1 (D,F). Images are presented alongside H&E stains (E,G) and in magnified insets.

