Figure 3.
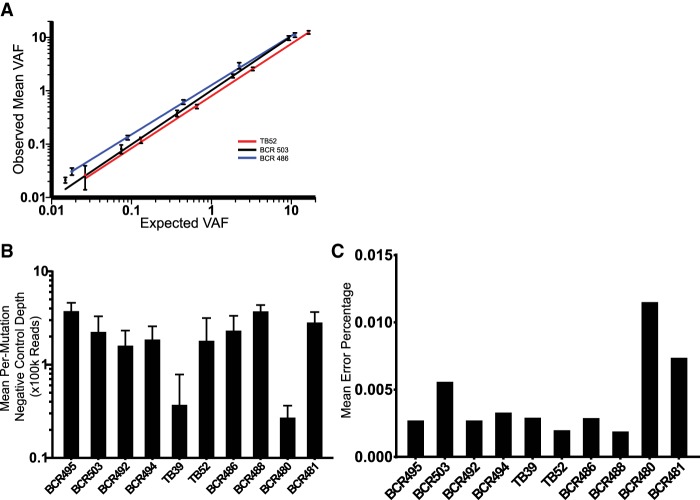
Hybrid capture panel performance. (A) Performance of three patient-specific mutation panels following serial dilution and error correction. Error bars ± SEM. (B) Mean per-mutation negative control depth for each patient-specific hybrid-capture panel. Error bars ± SEM. (C) Mean negative control error percentage for each patient-specific panel.

