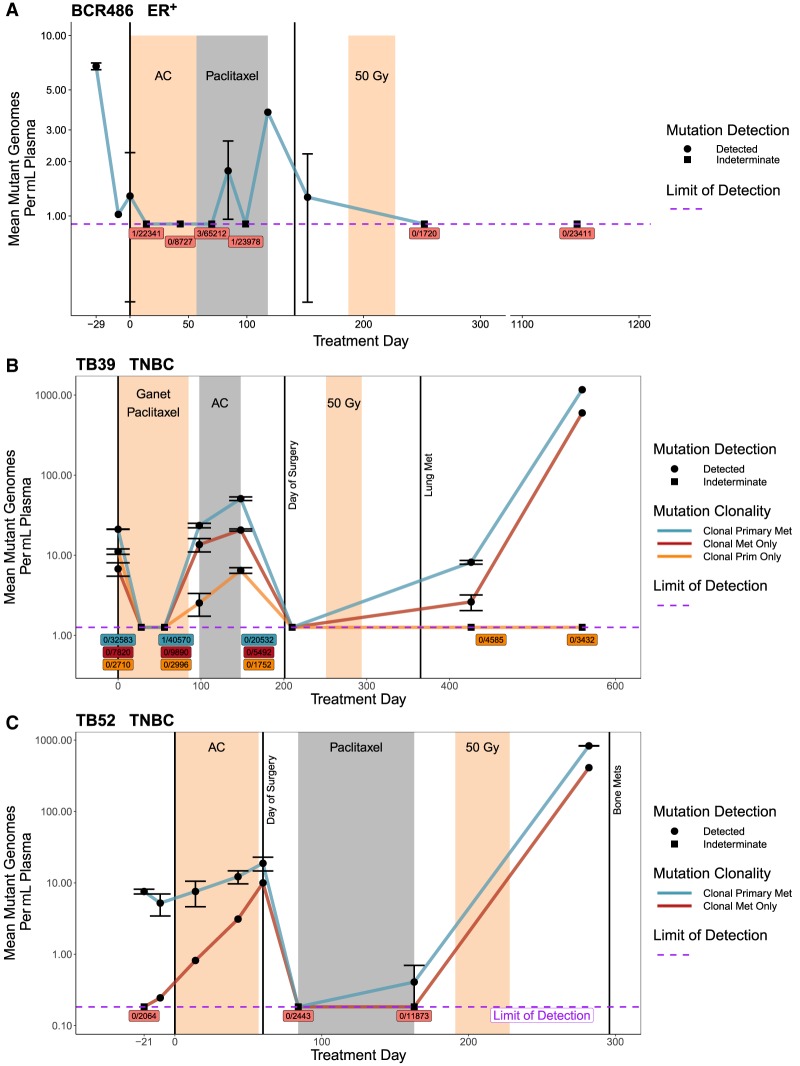
Figure 7.
ctDNA dynamics in patients with tumor growth during NAC. Serial ctDNA quantification using patient-specific mutation panels. Limit of detection calculated as mean across all time points (see Methods). Indeterminate time points have either 0 or a statistically insignificant number of mutant reads; those points are plotted at limit of detection. Indeterminate points are labeled by mutant reads/total reads, colored by mutation clonality. Error bars ± SEM; not all time points had replicates (see Supplemental Table 2). (A) Nineteen-mutation panel for BCR486. Variants analyzed were observed in WES of primary tissue. (B) Forty-five-mutation panel for TB39. Variants analyzed were observed in WES of primary tissue and metastatic tissue. (C) Twenty-one-mutation panel for TB52. Variants analyzed were observed in WES of primary tissue and cell-free DNA collected concurrent with clinical detection of metastasis.

