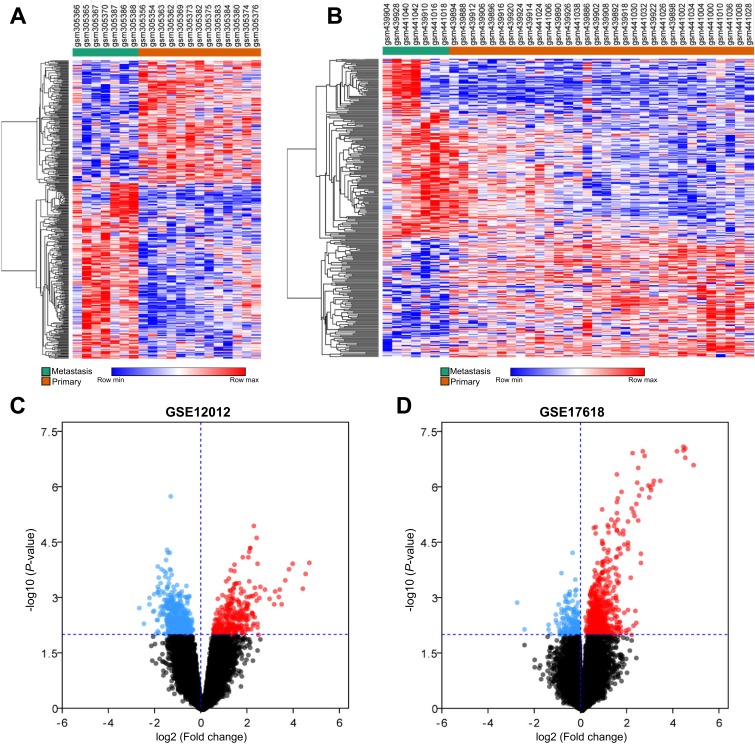
Figure 1.
Hierarchical cluster analysis and volcano plot of differentially expressed genes (DEGs) in metastasis samples and primary samples. (A and B) represent the DEGs obtained from GSE12102 and GSE17618 dataset, respectively. Each column represents a sample, and each row represents a single gene. Green color represented metastasis samples, and orange color represented primary samples. The color scale shows the relative genes expression level in certain slide: blue indicates low relative expression levels; red indicates high relative expression levels, white indicates zero (no change). (C and D) Volcano plot of DEGs in metastasis samples compared to primary samples. Red indicates the gene expression was upregulated in metastasis samples compared to primary samples (P<0.01); blue indicates the gene expression was downregulated in metastasis samples compared with primary samples (P<0.01); Black indicates the P-value was >0.01.

