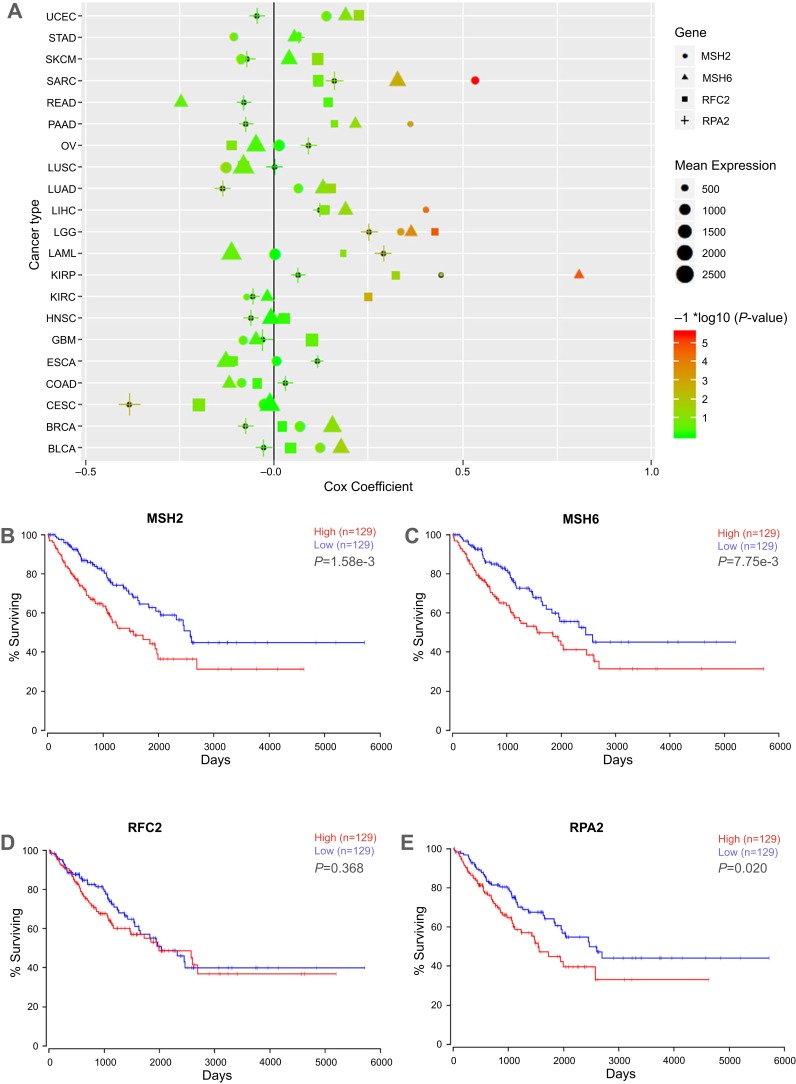
Figure 5.
Cox-regression and survival analyses of key genes in TCGA database. (A) Cox-regression result of the key genes in TCGA pan-cancer datasets. X axis represents cox coefficient value, positive value indicates high gene expression predicts poor prognoses of patients, negative value represents high gene expression predicts good prognoses; y axis represents cancer types in TCGA database. Different shapes represent different genes, shape size represents the mean expression level of target genes in specific cancer. The color accords with the –log10 (P-value). (B–E) Relationship between MSH2, MSH6, RPA2, and RFC2 expression and the survival of sarcoma patients analyzed using the TCGA SARC dataset. The high expression of the key genes showed in red curve, and the low expression of the key genes showed in blue curve.
Abbreviations: TCGA The Cancer Genome Atlas; UCEC, uterine corpus endometrial carcinoma; STAD, stomach adenocarcinoma ; SKCM, cutaneous melanoma; SARC, sarcoma; PRAD, prostate adenocarcinoma; PAAD, pancreatic ductal adenocarcinoma; OV, ovarian serous cystadenocarcinoma; LUSC, lung squamous cell carcinoma; LUAD, lung adenocarcinoma; LIHC, liver hepatocellular carcinoma; LGG, lower Grade Glioma; KIRP, papillary kidney carcinoma ; KIRC, clear cell kidney carcinoma; HNSC, head and neck squamous cell carcinoma; GBM, glioblastoma multiforme; ESCA, esophageal cancer; COAD, colon and rectal adenocarcinoma; CECA, cervical cancer; BRCA, breast cancer; BLCA, urothelial bladder cancer; AML, acute myeloid leukemia.

