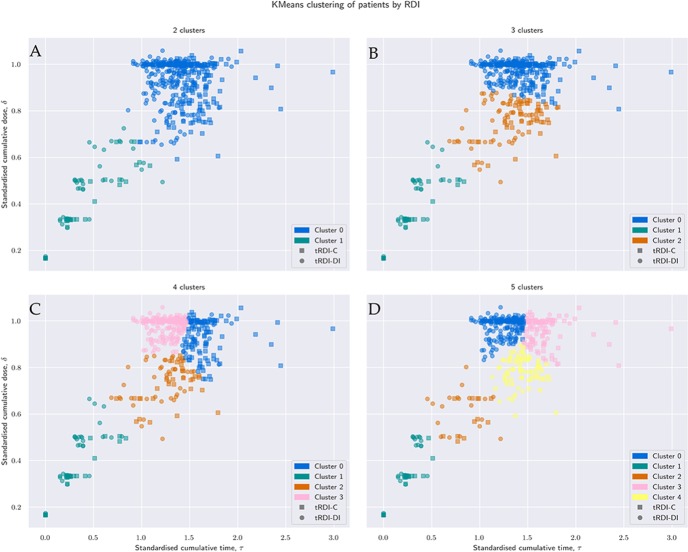
Figure 4.
Clustering result for different values of the desired number of clusters, k. Size, composition, precision and median values of quantities of interest are reported for each cluster and each value of k by table 2. For each of the four clustering results, figure 5 summarises the individual values of received dose intensity computed according to Lewis et al.15

