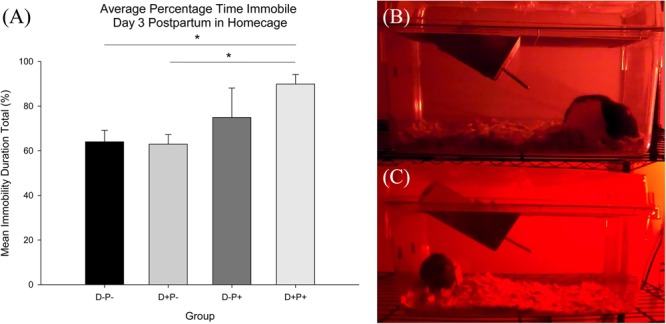
FIGURE 10.

(A) Average percentage time immobile in home-cage. Percentage immobility time was significantly reduced in the D+P+ group relative to D-P- and D+P-. ∗p < 0.05. Data is expressed as mean ± SEM. (B,C) Freeze-frame shot of home-cage behavior recording during dark cycle day 3 postpartum. (B) D+P+; hunched posture typical of D+P+ group and (C) D-P+; mother nursing pups.
