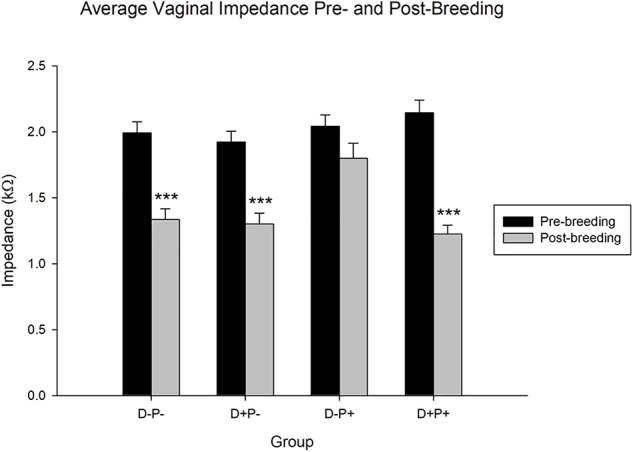
FIGURE 5.

Average vaginal impedance (kΩ) pre- and post-breeding. All groups with the exception of the D-P+ group showed a significant decrease in the average vaginal impedance over time. Data points include the impedance of rats from n = 19–21 rats/group for pre-breeding and n = 11–13 rats/group for post-breeding. Data is expressed as mean ± SEM. ∗∗∗p < 0.001 (Relative to pre-breeding levels).
