
FIGURE 6.
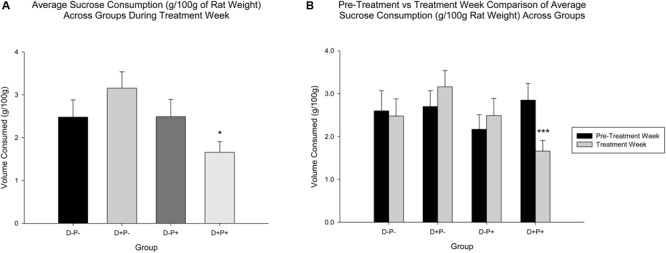
(A) Average sucrose consumption (g/100 g rat weight) during treatment week. Sucrose consumption was significantly reduced only in the pregnancy termination group (D+P+) relative to the D+P- group. n = 19–21 rats/group; ∗p < 0.05. (B) Average sucrose consumption (g/100 g rat weight) in pre-treatment vs. treatment week. The D+P+ group was the only group with a significant reduction in average sucrose consumption, during treatment week relative to pre-treatment week. n = 15–17 rats/group; ∗∗∗p < 0.001. Data is expressed as mean ± SEM.