
FIGURE 8.
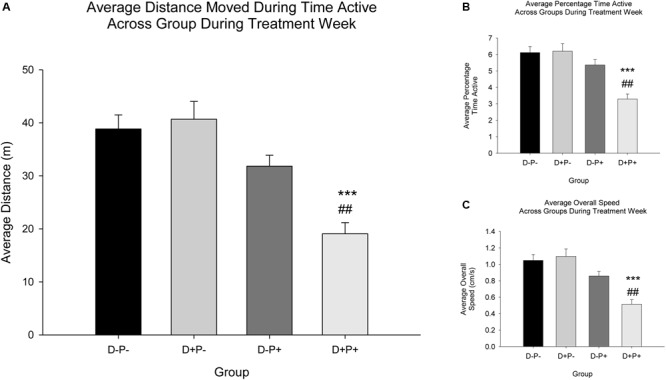
Locomotor parameters across groups during treatment week. (A) Average distance moved during time active (m); (B) Average percentage time active; (C) Average overall speed (cm/s). A significant decrease in all three parameters (A–C) was observed in the D+P+ group relative to all other groups (D-P-, D+P-, D-P+). ∗∗∗ p < 0.001 (Relative to D-P- and D+P-); ##p < 0.01 (Relative to D-P+). Data is expressed as mean ± SEM.