
FIGURE 9.
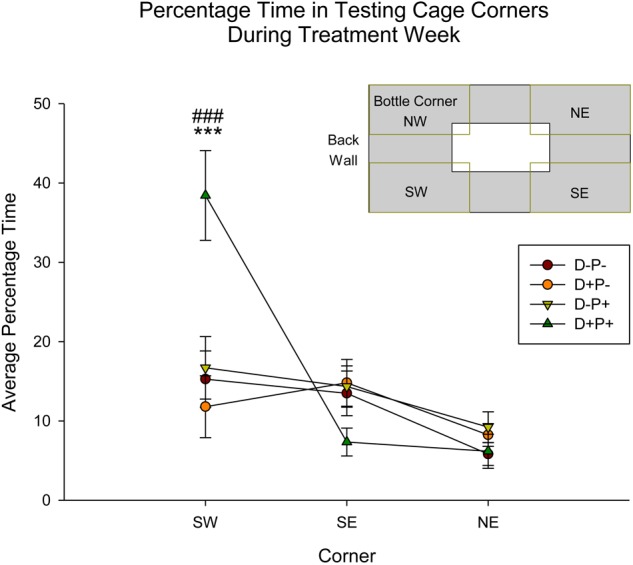
Percentage time in specific testing cage corners during treatment week. The D+P+ group spent significantly more time in the SW corner of the testing cage relative to all other groups, as well as relative to the SE and NE corners. ∗∗∗p < 0.001 (Relative to all groups); ###p < 0.001 (Relative to SE and NE corner). Data is expressed as mean ± SEM. Inset: Cage and corner orientation.