
Figure 1.
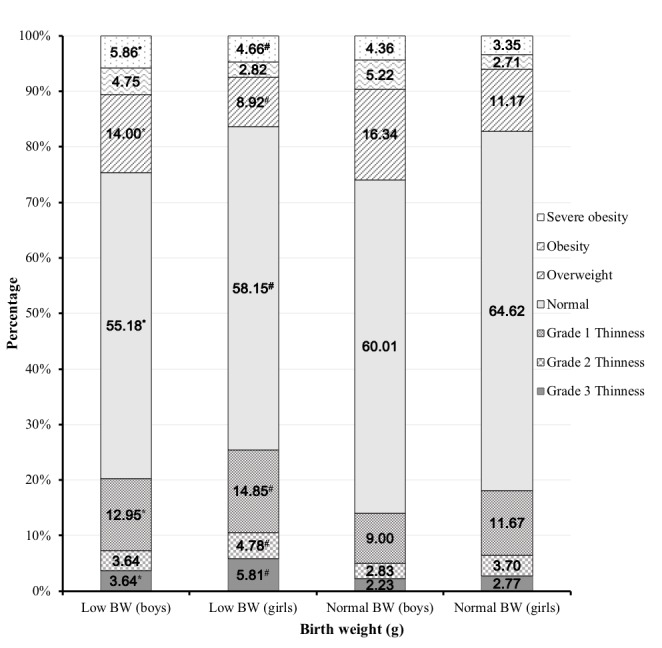
Percentage of thinness, overweight, obesity and severe obesity between low BW and normal BW. *Statistically significant difference between low BW and normal BW in boys (χ2 test, p<0.05); #Statistically significant difference between low BW and normal BW in girls (χ2 test, p<0.05). BW, birth weight.