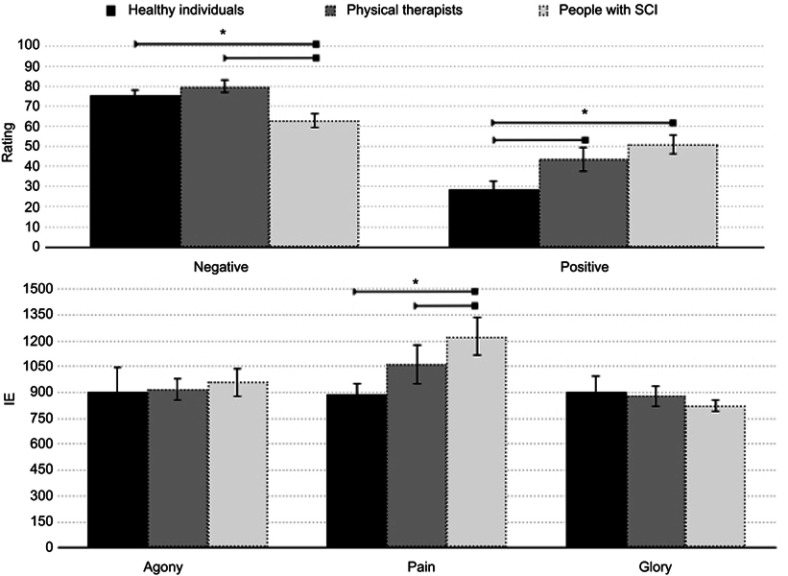
Figure 2.
Results obtained from the three groups of participants. Phase II (top panel): the y-axis reflects the ratings of positive and negative descriptors of pain obtained from the three groups of participants (healthy controls, people with SCI, and physical therapists), which are shown on the x-axis. Higher ratings indicate a stronger association of the word “pain” with negative or positive lexical dimensions. Phase III (bottom panel): the y-axis depicts the IE score obtained from the three groups of participants, shown on the x-axis, for the words “pain,” “agony,” and “glory.” Higher IE scores indicate greater response latency and less accuracy when the word “pain” is paired with a negative trait than when the word is paired with a positive trait. The error bars in both panels indicate the SEM, and asterisks (*) indicate significant results.
Abbreviations: SCI, spinal cord injury; IE, inverse efficiency.

