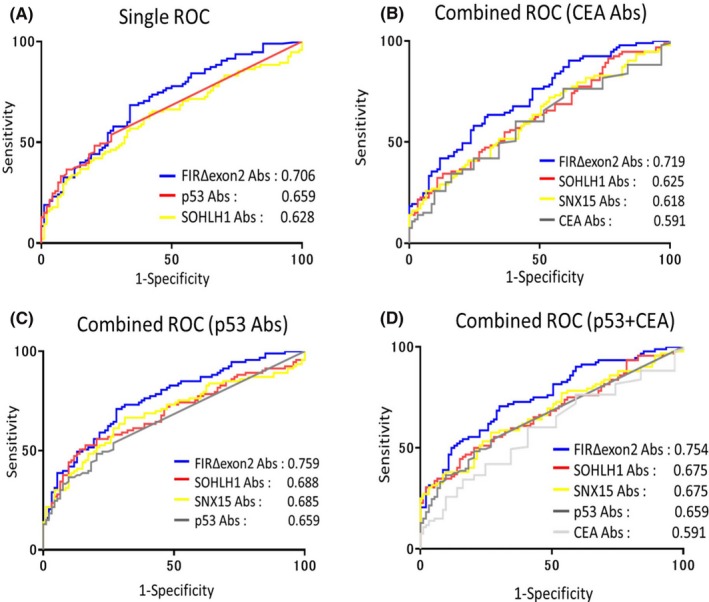
Figure 4.

Comparison of combined ROCs in ESCC patients. A, Overall diagnostic efficiency of seven Abs was evaluated by comparing ROC curves. AUC values were calculated using GraphPad Prism 7. Values are shown in descending order of AUC. B‐D, ROC analysis for the combination of candidate markers examined by the basis of Z score data normalized to SD of the quantified alpha count data of 95 patients with ESCC and 94 healthy subjects. Values are shown in descending order of AUC
