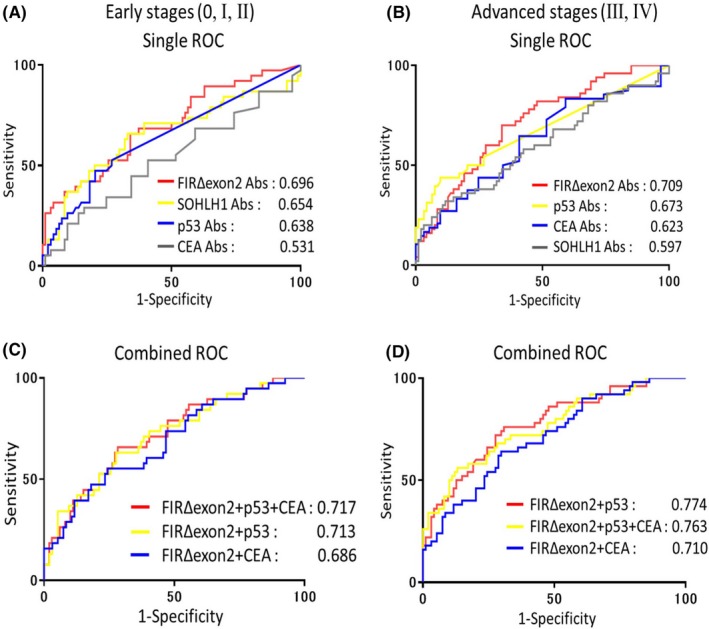
Figure 5.

The Receiver operating characteristic (ROC) ROC curve analysis depicting the diagnosis efficiency of FIRΔexon2 Abs in combination with SOHLH1, CEA, and p53 Ab markers in ESCC patients. A, Area under the ROC curve (AUC) values of candidate markers for early stage ESCCs. B, AUC values of candidate markers for advanced stage ESCCs. C, ROC analysis depicting the diagnosis efficiency of FIRΔexon2 Abs in combination with CEA/p53 Ab markers for early stage ESCCs. D, ROC analysis depicting the diagnosis efficiency of FIRΔexon2 Abs in combination with CEA/p53 Ab markers for advanced stage ESCCs
