
Figure 1.
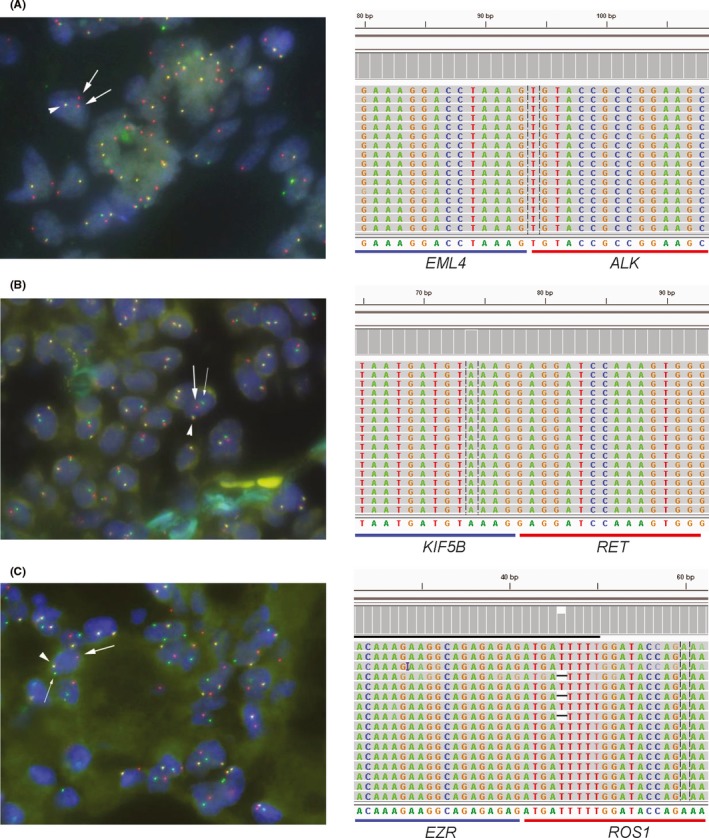
FISH analysis (left) and Integrative Genomics Viewer (IGV) diagram (right) of ALK, RET, and ROS1 fusion cases. A‐C, Representative FISH images for an ALK fusion‐positive specimen (A), a RET fusion‐positive specimen (B), and a ROS1 fusion‐positive specimen (C). Arrowhead, bold rightwards arrow, and the fine arrow show the pseudocolor signals of the 5′/3′ probe, the 5′ probe, and the 3′ probe, respectively