Figure 7.

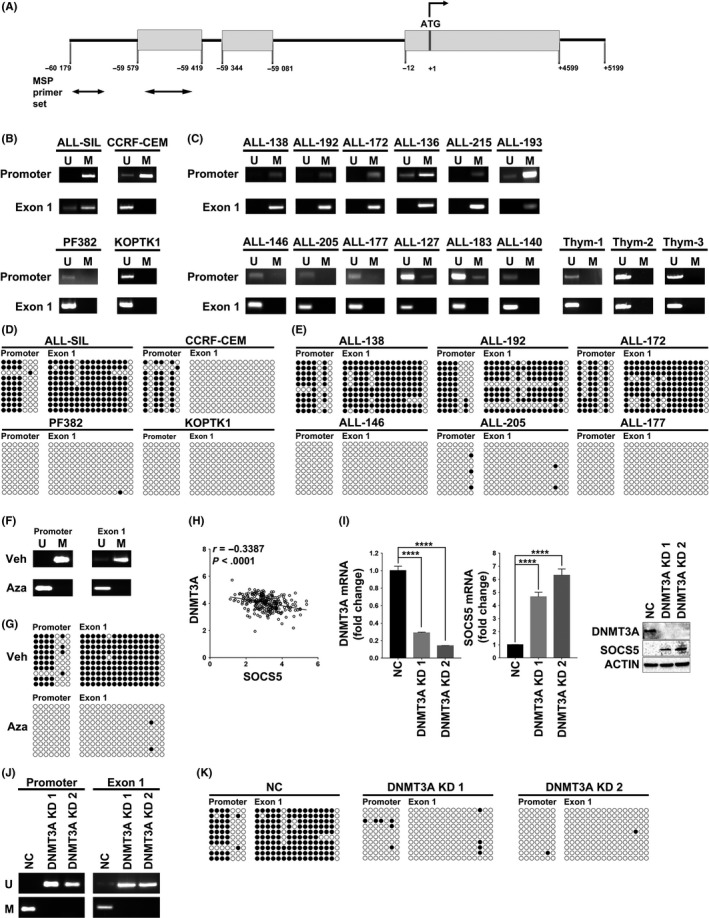
DNA methylation regulates suppressor of cytokine signaling 5 (SOCS5) expression. A, Schematic diagram of the SOCS5 gene. Gray boxes represent exons; the translation start site is at +1, and the arrows indicate direction of translation. The bottom arrows indicate primers used for methylation specific PCR (MS‐PCR). DNA methylation of SOCS5 promoter/1st exon in (B) T‐cell lineage acute lymphoblastic leukemia (T‐ALL) cell lines (n = 4) and (C) primary T‐ALL samples (n = 12) and normal thymocytes (n = 3) were tested by methylation specific (MS)‐PCR. M, methylated; U, unmethylated. D,E, Bisulfite sequencing of SOCS5 promoter/1st exon region in (D) T‐ALL cell lines (n = 4) and (E) primary T‐ALL samples (n = 6) for which sufficient DNA was available. Unmethylated CpG site in the amplified region is shown as an open, white circle and methylated CpG as a closed, black circle. F,G, DNA methylation (F) and bisulfite sequencing (G) of SOCS5 promoter/1st exon in ALL‐SIL cells treated with demethylating agent 5‐azacitidine (Aza) (24 h, 10 μmol/L) or vehicle control (Veh). H, Expression correlation between SOCS5 and DNA methyltransferase‐3A (DNMT3A) in a previously published RNASeq dataset for 264 T‐ALL patients from the COG study (NCT00408005)1 (r, Pearson correlation; P < .0001). I, ALL‐SIL cells were infected with scrambled control (NC) or lentivirus expressing shRNA targeting DNMT3A (DNMT3A KD1 and DNMT3A KD2). Knockdown of DNMT3A and SOCS5 gene expression was examined by quantitative real‐time PCR and immunoblotting. SOCS5 in negative control cells (NC) was normalized to 1. Data are means ± SD for 3 independent experiments (****P < .0001; two‐tailed Student's test). J,K, DNA methylation and bisulfite sequencing analyses of the SOCS5 promoter/1st exon in DNMT3A‐depleted ALL‐SIL cells compared to NC
