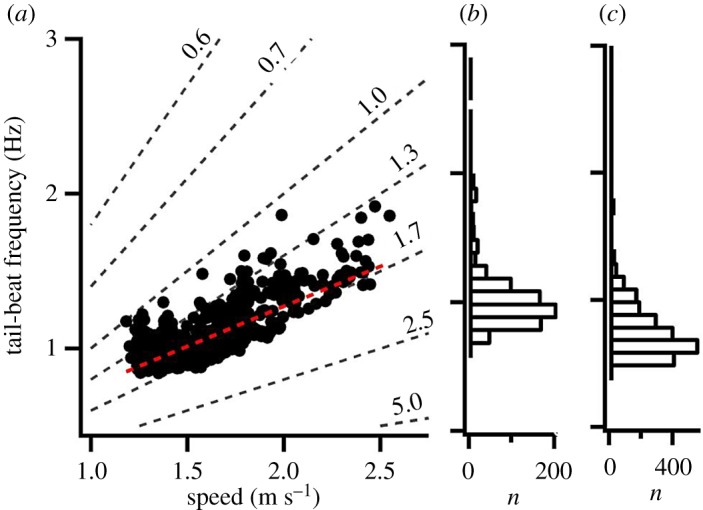
Figure 3.

Tail-beat frequencies during horizontal swimming of Atlantic bluefin tuna. Relationship between tail-beat frequency and swimming speed for level swimming in fish no. 1, red stippled line shows the linear fit (r2 = 0.59) (a) and the respective frequency distributions of tail-beat frequencies for the same fish (b) and fish no. 2 (c) during level swimming for the entire duration. Revealing that fish spent the vast majority at tail-beat frequencies below 1 Hz, equivalent to a swimming speed of less than 1.75 m s−1 or less than 0.7 body lengths s−1. Stippled lines represent constant stride-lengths in metres.
