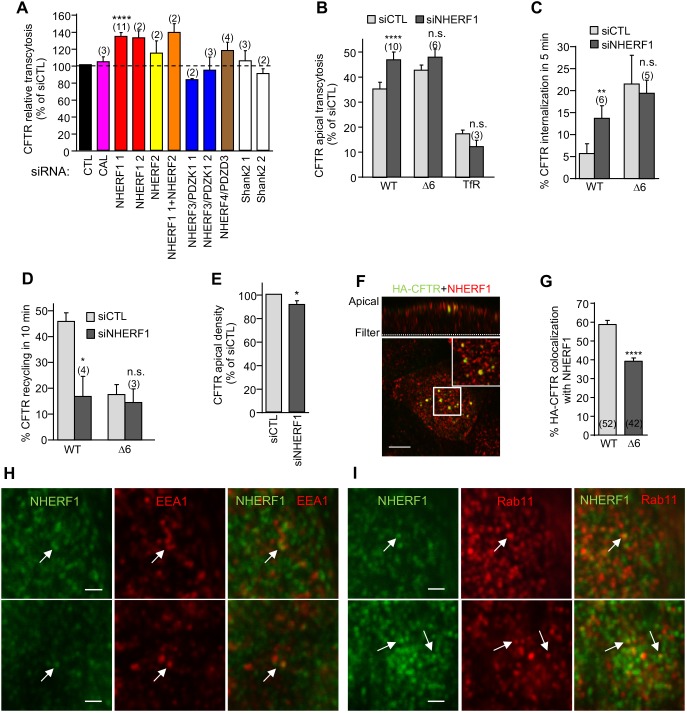
Fig. 7.
NHERF1 ablation phenocopies the Δ6-CFTR cellular phenotype. (A) CFTR transcytosis was assayed after siRNA-mediated knockdown of the indicated PDZ proteins in CFBE and expressed as the percentage of that seen with the control siRNA (CTL). (B–E) NHERF1 silencing mirrors the effect of the PDZ-binding motif truncation of CFTR. CFBE cells were transfected with control siCTL or NHERF1 1 siRNA and then assayed for (B) CFTR and TfR transcytosis following 3 h basolateral anti-HA or Tf-HRP capture, (C) CFTR internalization, (D) CFTR recycling, (E) CFTR apical PM density (n=10), measured as described in the Materials and Methods. (F) NHERF1 colocalizes with the apical endocytosed CFTR. CFTR was labeled by anti-HA capture (1 h, 37°C) from the apical compartment. Residual CFTR apical PM was blocked with goat anti-mouse Fab on ice. NHERF1 (red) and CFTR (green) were visualized by indirect immunostaining and laser confocal fluorescence microscopy in permeabilized cells. The upper panel represents a z-section. The insert is a 4-fold magnification of the indicated area. Scale bar: 5 µm. (G) Quantification of colocalization between NHERF1 and subapical endocytosed WT- and Δ6-CFTR in CFBE cells (two-tailed unpaired t-test). (H,I) NHERF1 can localize to both ASEs and AREs. Fixed and permeabilized filter-grown CFBE cells were stained for NHERF1 (green) and EEA1 (red, H) or Rab11 (red, I). Arrows indicate colocalization. Scale bars: 1 µm. Data are mean±s.e.m. on each panel, parentheses indicate the number of independent experiments (A–D) or number of regions of interest from two independent experiments (G). *P<0.05; **P<0.01; ****P<0.0001; n.s. not significant.

