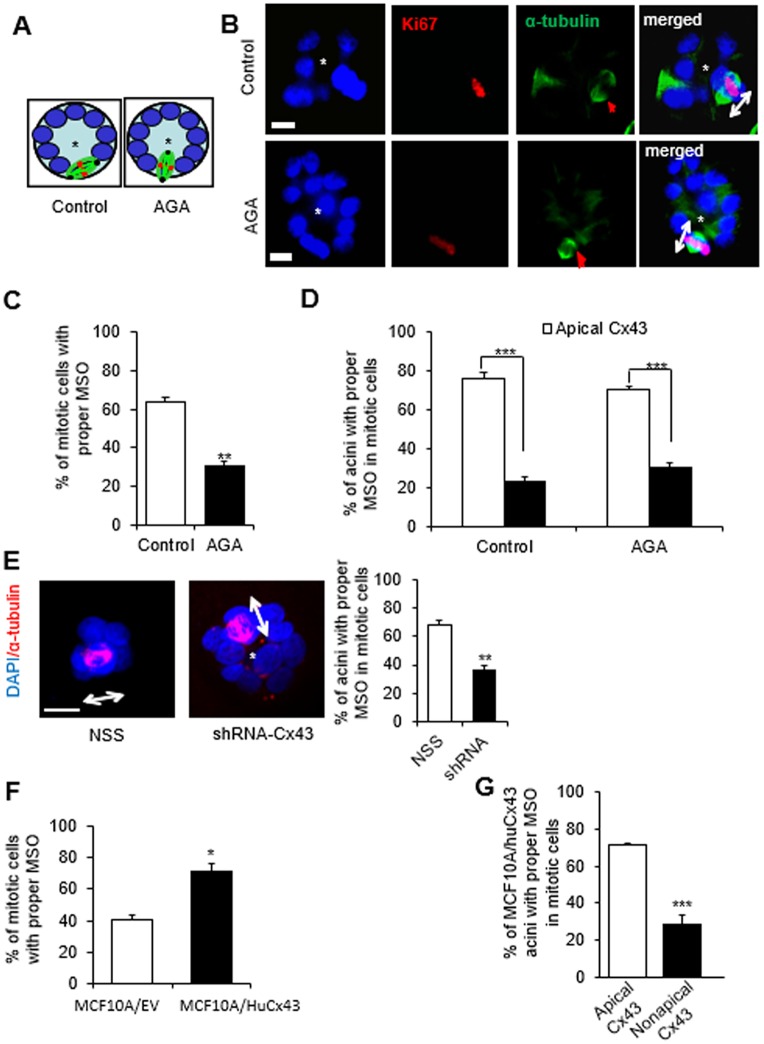
Fig. 6.
Cx43-mediated GJs regulate mitotic spindle orientation (MSO). (A–D) S1 cells were cultured in 3D and treated, pre-lumen assembly, with vehicle or with AGA until day 4. Resulting multicellular structures were dual-immunostained for Ki67 (red) and α-tubulin (green). MSO was analyzed based on the directionality of the α-tubulin poles, either parallel to the basement membrane (or tangential to the circumference of the growing acini), which is the proper MSO to maintain a monolayered epithelium, or non-tangential to the circumference (conducive to cell multilayering) as drawn in A, and shown on representative structures in B. Red arrows in α-tubulin panels point to mitotic spindles and double-headed arrows in merge panels indicate MSO; the asterisk indicates the center of the acinar structure; nuclei are counterstained with DAPI (blue). (C) Graph shows mean±s.e.m. percentages of S1 cells that demonstrate proper MSO; at least 60 mitotic cells analyzed per group; n=3; non-paired t-test. (D) Mean±s.e.m. percentages of acinar structures with mitotic cells that show ‘correct’ MSO depending on the location of Cx43 (usually only one mitotic cell seen per acinus). At least 60 cells in each treatment group analyzed; n=3. (E) Representative acinar structures of S1 cells transduced with non-specific sequence (NSS) shRNA or with Cx43 shRNA (shRNA-Cx43) and immunostained for α-tubulin (red); double-headed arrows indicate MSO; the asterisk indicates the center of the acinar structure; nuclei are counterstained with DAPI (blue). Graph shows mean±s.e.m. percentages of S1 cells that show proper MSO; at least 60 mitotic cells analyzed per group; n=3; unpaired t-test. (F,G) MCF10A/HuCx43 and MCF10A/EV cells were cultured in 3D for four days and dual immunostained for Cx43 and α-tubulin. Graphs show mean±s.e.m. percentages of cells that display ‘correct’ MSO; n=3 (F) and percentages of MCF10A/HuCx43 acini with mitotic cells that that show ‘correct’ MSO depending on the location of Cx43 (G). At least 60 mitotic cells analyzed per group; n=3. *P<0.05, **P<0.01, ***P<0.001; unpaired t-test (C,F,G), one-way ANOVA with Dunn's comparison (D). Scale bars: 10 µm.

