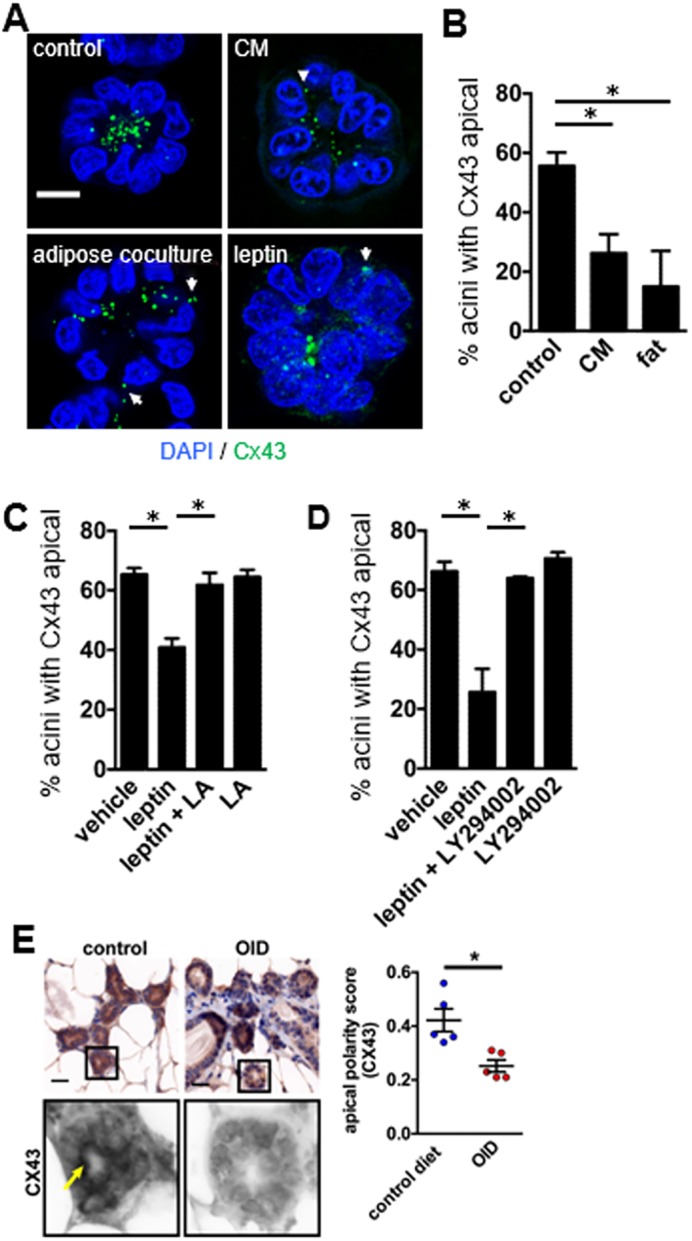
Fig. 8.

Cx43 localization is altered in models of overweight condition. (A) Representative images of Cx43 localization in S1 acini, treated for 72 h on day 10 of culture (post-lumen assembly) with mammary adipose tissue explants (adipose coculture), with conditioned medium (CM) from adipose tissue, or with recombinant leptin (100 ng/ml). Nuclei were stained with DAPI. Arrows and arrowhead indicate non-apical distribution of Cx43. Scale bar: 10 µm. (B–D) Mean±s.e.m. quantification of apical Cx43 localization in acini cultured in the presence of adipose tissue explants or CM (B), and in acini treated post-lumen assembly with leptin, a leptin receptor antagonist (LA) (C), or leptin and PI3K inhibitor LY294002 (D). *P<0.05, one-way ANOVA with Tukey test. (E) Immunohistochemical analysis of Cx43 distribution in whole-mount mammary glands from mice fed control or obesity-inducing diets (OID). Cx43 signals were extracted from immunohistochemistry images using spectral imaging (bottom images). The arrow points to apical Cx43 signals. Cx43 localization was evaluated with a three-grade scale (0=no apical signal; 1=partial, discontinuous apical signal lining the lumen; 3=continuous apical signal) by two investigators blind to the treatment conditions (≥25 acini or mammary ducts analyzed for each animal). Cx43 localization is quantified in the graph. Data represented as mean±s.e.m.; *P<0.01; unpaired t-test. Scale bar: 25 µm.
