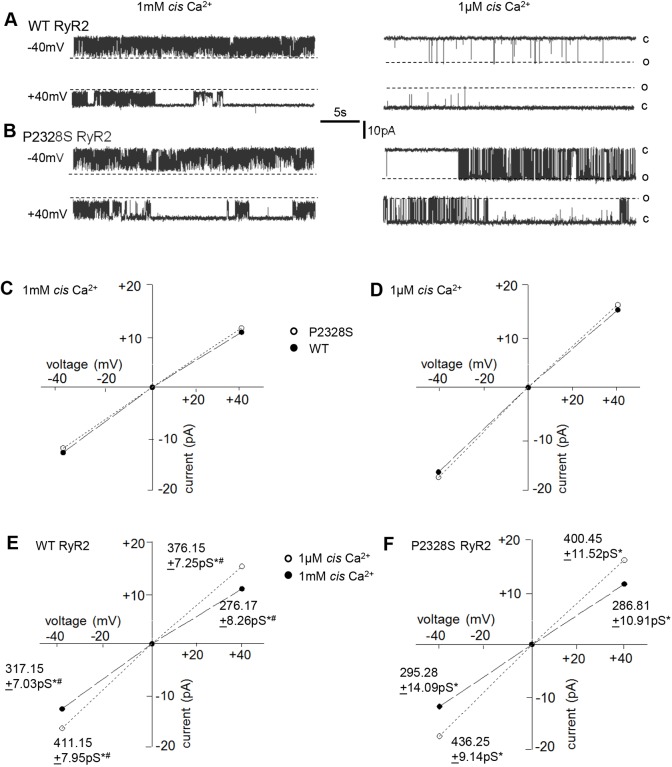
Fig. 1.
The P2328S mutation enhances RyR2 channel activity when cytoplasmic [Ca2+] is 1 µM, without altering maximum channel conductance. (A,B) Representative 25 s recordings from one WT RyR2 channel (A) and one P2328S RyR2 channel (B), with 1 mM Ca2+ (left panels) or 1 µM cytoplasmic Ca2+ (right panels), at −40 mV (upper record) or +40 mV (lower record). Broken lines (o) indicate maximum open currents, and solid lines (c) indicate the closed current levels. (C,D) Average maximum single channel currents plotted against voltage with 1 mM (C) or 1 μM (D) Ca2+. Dashed lines through filled circles connect WT data and dotted lines through open circles connect P2328S data. (E,F) Data from C and D replotted to emphasise the conductance difference between 1 mM with 1 μM Ca2+ in WT (E) or P2328S (F) RyR2. Dashed lines through filled circles connect 1 mM Ca2+ data, and dotted lines through open circles connect 1 µM Ca2+ data. Data points include mean±s.e.m. Error bars are within the symbol dimensions in all cases. Mean conductance (±s.e.m.) values are given beside their respective symbols. n=20 channels, WT, 1 mM Ca2+, −40 mV; n=24 channels, WT, 1 μM, −40 mV; n=22 channels, WT 1 mM Ca2+, +40 mV; n=23 channels, WT, 1 μM Ca2+, +40 mV. n=17 channels P2328S, 1 mM Ca2+, −40 mV; n=21 channels, P2328S, 1 μM Ca2+, −40 mV; n=18 channels, P2328S 1 mM Ca2+, +40 mV; n=22 channels, P2328S, 1 μM, +40 mV. #P<0.05 between average data at −40 and +40 mV; *P<0.05 between conductances with 1 mM and 1 µM Ca2+. There was no significant difference between average WT and P2328S RyR2 conductances under any condition.

