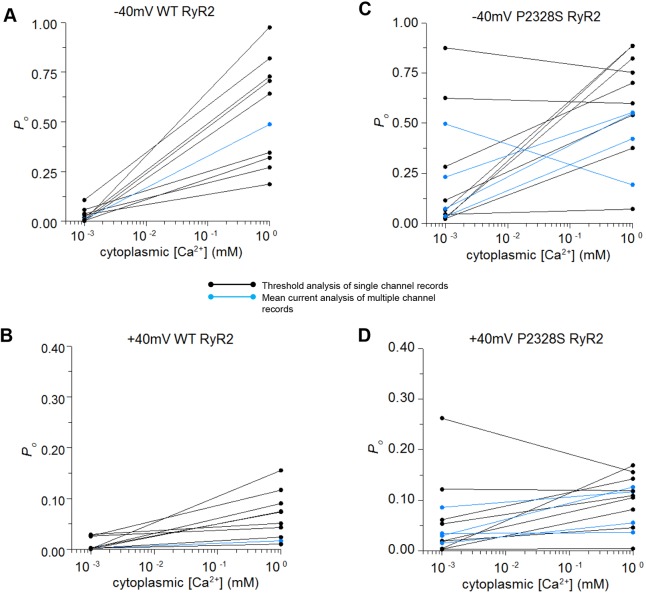
Fig. 2.
The Po of individual channels at 1 µM and 1 mM cytoplasmic [Ca2+] show substantial variability between P2328S channels with 1 µM Ca2+. (A,B) WT channels. (C,D) P2328S channels. Po at −40 mV plotted in A and C; Po at +40 mV plotted in B and D. Black lines link individual channel data from bilayers containing one active channel (Po determined with a threshold discriminator). Blue lines link measurements from bilayers with more than one channel opening (Po estimated from I′F, the mean current normalised to maximum current, see Materials and Methods). Notably, Po values derived from I′F fall within the range of values obtained from direct measurement of Po.

