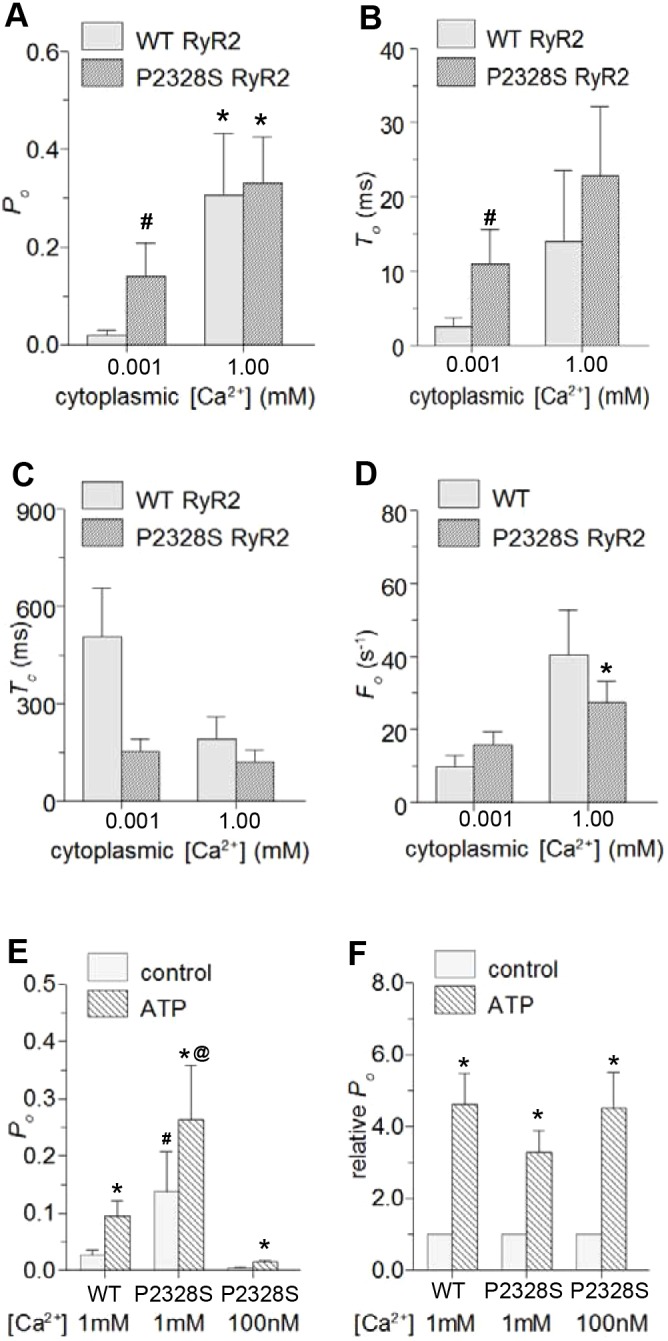
Fig. 3.

Average gating parameters for WT and P2328S RyR2 channels exposed to 1 μM or 1 mM cytoplasmic Ca2+ and effects of ATP reveal significantly higher activity in P2328S with 1 μM Ca2+. Average data (−40 and +40 mV pooled) for WT (light grey) and P2328S RyR2 (dark grey). (A–D) Mean±s.e.m. values for Po (WT n=20; P2328S n=26), To (WT n=16; P2328S n=18), Tc (WT n=18; P2328S n=20) and Fo (WT n=18; P2328S n=20). *P<0.05 between 1 µM and 1 mM Ca2+. # P<0.05 between WT and P2328S. (E,F) Mean±s.e.m. data for WT (n=7) and P2328S (n=5) channels before (solid grey bars) and after (cross-hatched bars) exposure to 2 mM ATP, with cytoplasmic Ca2+ of 1 μM (n=7 WT; n=5 P2328S) or 100 nM (n=2 P2328S) as indicated. Absolute Po (E); relative Po (F). *P<0.05 for ATP being greater than control, #P<0.05 for P2328S control with 1 μM Ca2+ being greater than WT or P2328S control at 100 nM Ca2+; @P<0.05 for P2328S with 1 µM Ca2+ plus ATP being greater WT with 1 μM Ca2+ plus ATP or P2328S with 100 nM Ca2+ plus ATP.
