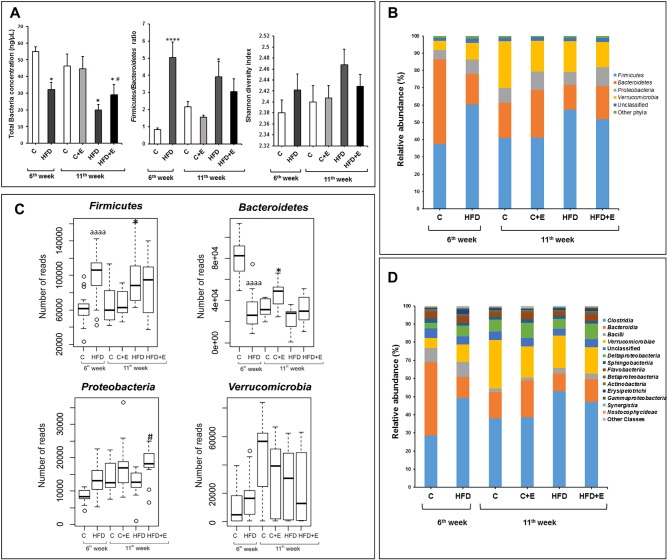
Fig. 2.
Effects of diet, exercise and age on gut microbiota composition. (A) Total bacterial concentration analyzed by quantitative PCR, Shannon diversity index and Firmicutes/Bacteroidetes ratio. Data are means±s.e.m. *P<0.05 versus control, ****P<0.0001 versus control; #P<0.05 versus HFD. (B) Relative abundances of the indicated total populations at phylum level. (C) Box plots showing differences in the numbers of reads of Firmicutes, Bacteroidetes, Proteobacteria and Verrucomicrobia phyla. The boxes represent the interquartile range (IQR) between the first and third quartiles (25th and 75th percentiles, respectively) and the horizontal line inside the box defines the median. Whiskers represent the lowest and highest values within 1.5 times the IQR from the first and third quartiles, respectively. Samples exceeding those values are represented as points beside the boxes. Statistical analysis was performed using Kruskal–Wallis followed by Mann–Whitney U-test; aaaaP<0.0001 versus control (week 6); *P<0.05 versus control; #P<0.05 versus HFD. (D) Relative abundances of the indicated populations at class level.

