Fig. 2.
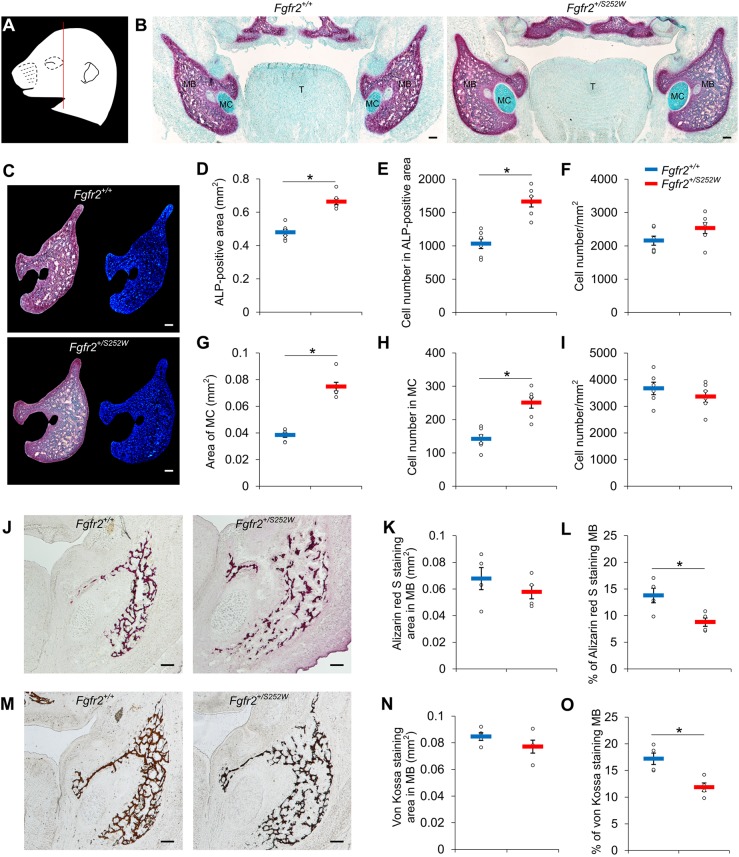
Histological analysis of mandible of Fgfr2+/S252W embryos at E16.5. (A) Schematic embryonic mouse head at E16.5 modified from the e-Mouse Atlas Project (http://www.emouseatlas.org/emap/eHistology). The red line indicates the location of sections used for B-O. (B) Cryosections of Fgfr2+/+ and Fgfr2+/S252W embryos were stained with the ALP assay (red) and Alcian Blue. MB, mandibular bone; MC, Meckel's cartilage; T, tongue. (C) The ALP-positive regions (red) were selected to quantify the areas and numbers of nuclei stained with Hoechst 33258 (blue). (D-I) The areas (D,G), cell numbers (E,H) and cell density (F,I) in the ALP-positive regions for Fgfr2+/+ (n=6) and Fgfr2+/S252W (n=6) embryos and MC of Fgfr2+/+ (n=6) and Fgfr2+/S252W (n=6) embryos. (J,M) Alizarin Red S staining (J) and von Kossa staining (M) showing ossification in the mandible of Fgfr2+/+ and Fgfr2+/S252W embryos. The areas and the percentages of the stained area in osteogenic tissue were measured for Alizarin Red S (K,L) and von Kossa (N,O) staining. Data are mean±s.e.m. *P<0.05, two-tailed Welch's t-test. Scale bars: 100 µm.

