Fig. 4.
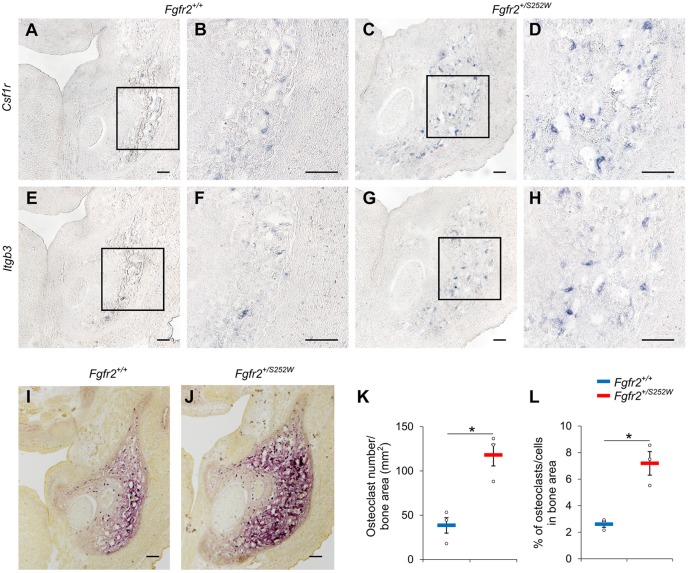
Increased osteoclastogenesis in the mandibular bone of Fgfr2+/S252W embryos at E16.5. (A-H) The differential expression of Csf1r and Itgb3 in the mandible of Fgfr2+/+ (A,B,E,F) and Fgfr2+/S252W (C,D,G,H) embryos were validated by in situ hybridization (ISH). B,D,F and H show higher magnification of the boxed areas in A,C,E and G, respectively. (I-J) TRAP assay stained osteoclasts (purple) in the mandible of Fgfr2+/+ (I) and Fgfr2+/S252W (J) embryos. (K-L) Quantitative measurements of the density (K) and percentage (L) of osteoclasts in the bone area of Fgfr2+/+ (n=3) and Fgfr2+/S252W (n=3) embryos. Data are mean±s.e.m. *P<0.05, two-tailed Welch's t-test. Scale bars: 100 µm.

