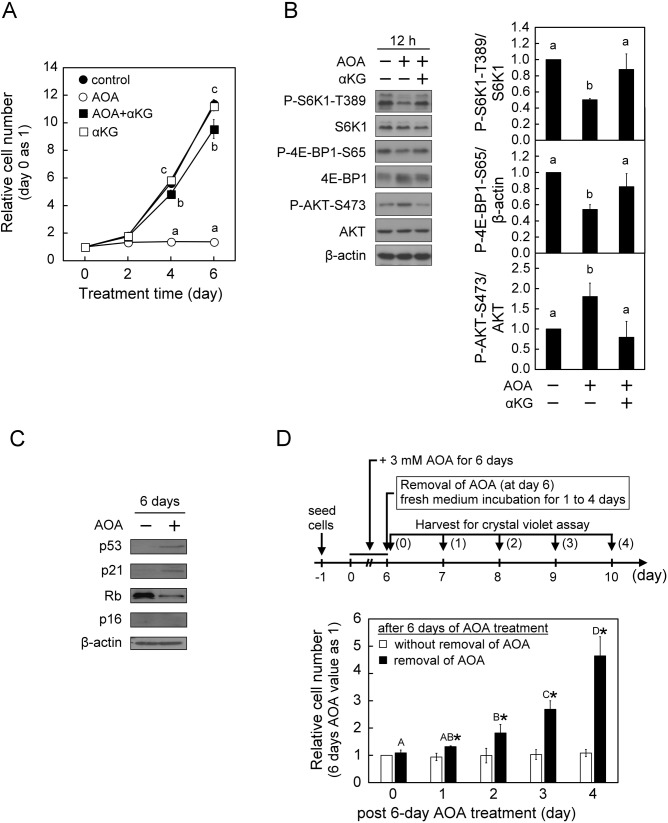
Fig. 4.
AOA treatment leads to inhibition of proliferation, mTORC1 inhibition−mTORC2 activation, but not cellular senescence in p16INK4A-deficent U2OS cells. U2OS cells were treated with vehicle or 3 mM AOA in the absence or presence of 5 mM αKG for the indicated time-periods with medium changed at 2-day intervals. (A) Effect of AOA on cell proliferation. Cell numbers were assessed and calculated as described in Fig. 1A. (B) Effect of AOA on mTORC signaling. After 12 h of treatment, cell lysates were prepared and analyzed for the activation status of mTORC1 and mTORC2, respectively, indicated by P-S6K1-T389/S6K1, P-4E-BP1-S65/β-actin and P-AKT-S473/AKT as described in Fig. 1B. (C) Effect of AOA on senescence-inducing regulators. After treatment for 6 days, cell lysates were prepared and analyzed by immunoblotting and densitometry analysis for Rb, p53, p21CIP1 and p16INK4A, β-actin served as a loading control. (D) Effect of AOA removal on cell proliferation. U2OS cells were treated with 3 mM AOA for 6 days, followed by culture in fresh medium with or without AOA for an additional 4 days. Cell numbers were assessed using Crystal Violet assay, and the relative cell numbers were calculated by normalizing against the value of day 0 of post-6 day AOA treatment. All quantitative data are expressed as the mean±s.e.m. (n=3) of three independent experiments, and different lowercase letters indicate significant difference among treatment groups at the same time-point (P<0.05). Different uppercase letters indicate significant difference of the same treatment group at different time-points (P<0.05). Asterisk (*) designates a significant difference compared with the respective vehicle control (P<0.05).

