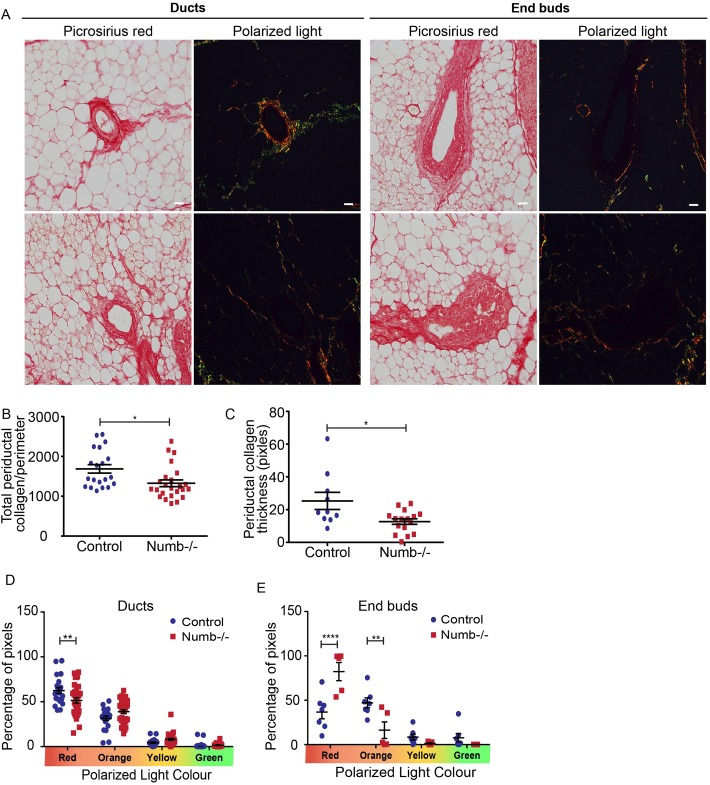
Fig. 3.
Density and organization of collagen is affected by Numb. (A) Brightfield and polarized light images of Picrosirius Red stained mammary tissue sections from control and Numb-deficient mice. (B) Scatter plot of total periductal collagen normalized to the perimeter of the duct from polarized light images. n=20–24 ducts from five to six glands for each group. (C) Scatter plot of the mean thickness (width) of collagen around ducts from polarized light images. n=13–16 duct from four glands for each group. (D) Quantification of the proportion of pixels binned into red, orange, yellow and green categories from polarized images of periductal collagen. n=22–33 ducts from six to seven glands for each group (multiple t-test). (E) Quantification of the proportion of pixels binned into red, orange, yellow and green from polarized light images of collagen surrounding control and Numb-deficient end buds. n=5–7 end buds from three to five glands (multiple t-test). Error bars=s.e.m. Unpaired t-test; two-tailed: ****P<0.0001, **P<0.01, *P<0.05. Scale bar: 50 μm.

