Fig. 1.
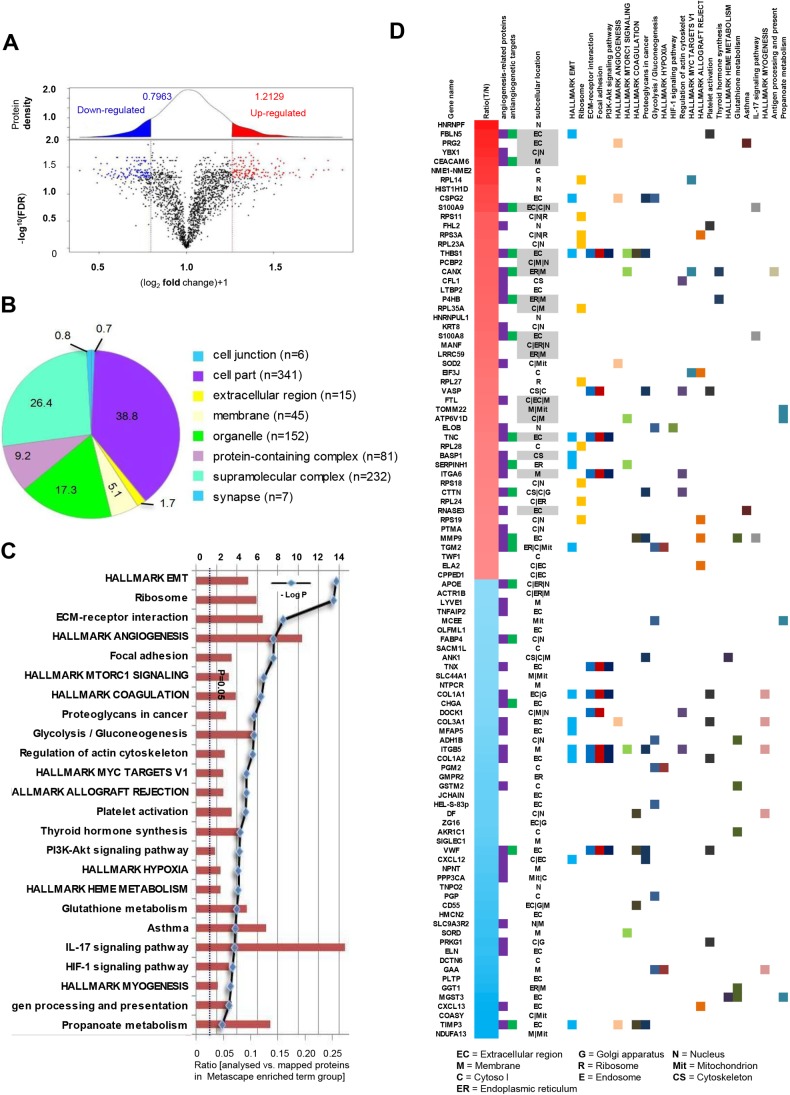
Integrative analysis of identified proteins. (A) The ratio intensity plot representing protein fold change (iTRAQ ratio versus corresponding summed peptide intensity distribution) and protein density plot (upper panel). Red, blue and black clusters indicate up-, down- and unregulated proteins, respectively. (B) A total of 2058 proteins was classified according to the cell components with PANTHER. (C) Metascape pathway analysis mapped the DEPs to 24 signaling pathways. (D) Heatmap of top 50 up- and top 50 downregulated proteins mapping to each Metascape pathway terms group. The subcellular location of each protein is also presented and upregulated proteins that are either secreted or membrane are highlighted in gray as potential therapeutic targets.

