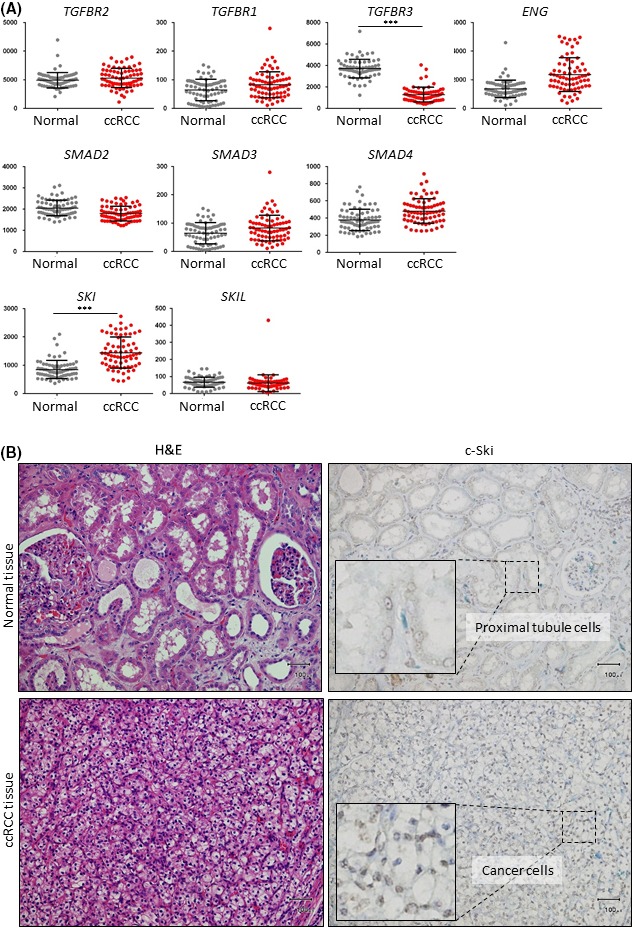
Figure 1.

Upregulation of c‐Ski expression in clear cell renal carcinoma (ccRCC) tissues. A, Comprehensive analysis of gene expression data from the NCBI Gene Expression Omnibus (GEO) database (GSE53757) shows expression levels of transforming growth factor beta (TGF‐β) signaling pathway components in ccRCC tissues (n = 72) and matched normal renal tissues (n = 72). Expression values are shown by dot plots. Data represent the mean ± SD. ***P < .001. B, Images of immunohistochemical staining with an anti‐c‐Ski antibody and H&E staining of ccRCC tissues and corresponding normal renal tissues from the same patient. c‐Ski staining in boxed region is shown at high magnification. Scale bars are 100 μm. ENG, endoglin
