
Figure 3.
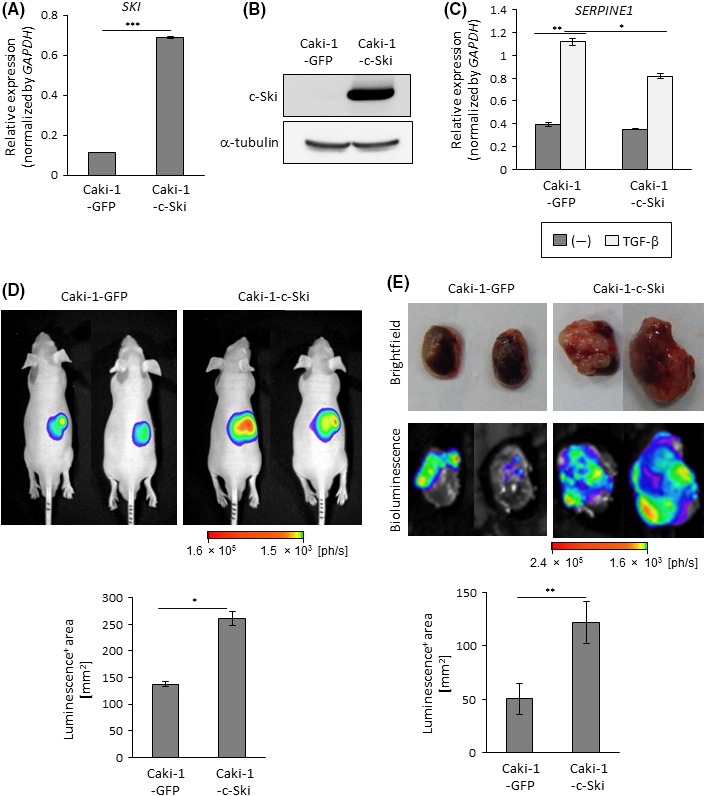
Enhanced tumor formation by c‐Ski in Caci‐1 cells. A, Caki‐1 cells were infected with lentiviral vectors encoding GFP (Caki‐1‐GFP) or c‐Ski (Caki‐1‐c‐Ski) and analyzed by qRT‐PCR for SKI expression. Data represent the mean ± SD. ***P < .001. B, Immunoblots of lysates of Caki‐1‐GFP and Caki‐1‐c‐Ski cells with the indicated antibodies. C, qRT‐PCR analysis of SERPINE1 expression. Caki‐1‐GFP and Caki‐1‐c‐Ski cells were stimulated with transforming growth factor beta (TGF‐β) for 2 h and analyzed by qRT‐PCR. Data represent the mean ± SD. *P < .05, **P < .01. D, Tumor‐forming ability of Caki‐1 cells. BALB/c nu/nu male mice received renal orthotopic injection of Caki‐1‐GFP (n = 6) or Caki‐1‐c‐Ski (n = 5) cells. Upper panels: representative photographs of in vivo bioluminescence imaging of tumor‐bearing mice 3 wks after the injection. Lower panel: luminescence‐positive area in all mice; data represent the mean ± SE. *P < .05. E, Tumor‐forming ability of Caki‐1 cells. Tumor formation in mice in (D) was examined 5 wks after the injection. Upper panels: representative photographs of brightfield and ex vivo bioluminescence imaging of extracted kidneys. Lower panel: luminescence‐positive area; data represent the mean ± SE. **P < .01